This is a read-only mirror of pymolwiki.org
Volume
Jump to navigation
Jump to search
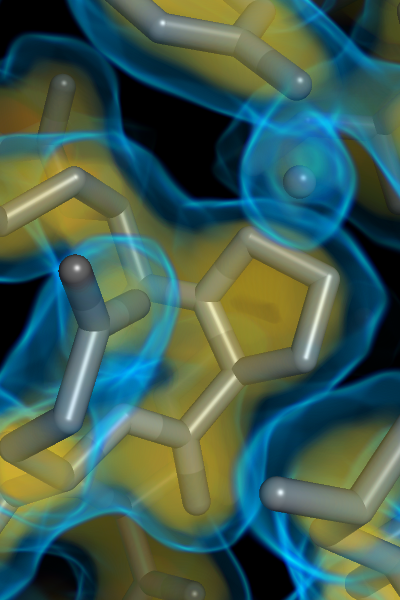
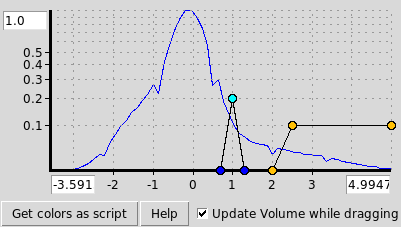
Volume creates a new volume object from a map object. The data (3D scalar fields) are shown as a true 3D object using coloring and transparencies defined by the user to illustrate the data values.
This technique supports single and multiple isosurfaces.
Usage
volume name, map [, ramp [, selection [, buffer [, state [, carve ]]]]]
Arguments
- name = the name for the new volume object.
- map = the name of the map object to use for computing the volume.
- ramp = str: named color ramp {default: }
- selection = an atom selection about which to display the mesh with an additional "buffer" (if provided).
- carve = a radius about each atom in the selection for which to include density. If "carve" is not provided, then the whole brick is displayed.
Example
fetch 1oky, type=2fofc, async=0
volume 1okyVol, 1oky_2fofc
Screencasts
- Silent demo movie showing the basics of loading and using a volume in PyMOL. There are more capabilities, but this is the basic functionality.
Changes with PyMOL Version
- 1.4.0: first version with volume support
- 1.7.2:
- pre-integrated volume rendering (volume_mode=1) as Incentive-PyMOL-only feature.
- scripting support with custom color ramp (volume_color, volume_ramp_new)
- improved volume panel, panel can be opened from the object menu ("C > panel")
- lots of bugs fixed
Known Limitations
- No real ray-tracing support yet
- Multiple volume objects don't blend properly

