This is a read-only mirror of pymolwiki.org
Difference between revisions of "Axes"
Jump to navigation
Jump to search
| (2 intermediate revisions by the same user not shown) | |||
| Line 26: | Line 26: | ||
</source> | </source> | ||
| − | [[Category: | + | |
| + | This script draws a simple cartesian coordinate system. | ||
| + | |||
| + | <source lang="python"> | ||
| + | from pymol.cgo import * | ||
| + | from pymol import cmd | ||
| + | |||
| + | w = 0.06 # cylinder width | ||
| + | l = 0.75 # cylinder length | ||
| + | h = 0.25 # cone hight | ||
| + | d = w * 1.618 # cone base diameter | ||
| + | |||
| + | obj = [CYLINDER, 0.0, 0.0, 0.0, l, 0.0, 0.0, w, 1.0, 0.0, 0.0, 1.0, 0.0, 0.0, | ||
| + | CYLINDER, 0.0, 0.0, 0.0, 0.0, l, 0.0, w, 0.0, 1.0, 0.0, 0.0, 1.0, 0.0, | ||
| + | CYLINDER, 0.0, 0.0, 0.0, 0.0, 0.0, l, w, 0.0, 0.0, 1.0, 0.0, 0.0, 1.0, | ||
| + | CONE, l, 0.0, 0.0, h+l, 0.0, 0.0, d, 0.0, 1.0, 0.0, 0.0, 1.0, 0.0, 0.0, 1.0, 1.0, | ||
| + | CONE, 0.0, l, 0.0, 0.0, h+l, 0.0, d, 0.0, 0.0, 1.0, 0.0, 0.0, 1.0, 0.0, 1.0, 1.0, | ||
| + | CONE, 0.0, 0.0, l, 0.0, 0.0, h+l, d, 0.0, 0.0, 0.0, 1.0, 0.0, 0.0, 1.0, 1.0, 1.0] | ||
| + | |||
| + | cmd.load_cgo(obj, 'axes') | ||
| + | </source> | ||
| + | |||
| + | Save the script and run it in Pymol. Tested in version 1.3. | ||
| + | [[File:Axes_demo.png|400px|left]] | ||
| + | |||
| + | |||
| + | [[Category:Script_Library|Axes]] | ||
| + | [[Category:Math_Scripts|Axes]] | ||
Revision as of 12:16, 27 March 2011
# axes.py
from pymol.cgo import *
from pymol import cmd
from pymol.vfont import plain

# create the axes object, draw axes with cylinders coloured red, green,
#blue for X, Y and Z

obj = [
   CYLINDER, 0., 0., 0., 10., 0., 0., 0.2, 1.0, 1.0, 1.0, 1.0, 0.0, 0.,
   CYLINDER, 0., 0., 0., 0., 10., 0., 0.2, 1.0, 1.0, 1.0, 0., 1.0, 0.,
   CYLINDER, 0., 0., 0., 0., 0., 10., 0.2, 1.0, 1.0, 1.0, 0., 0.0, 1.0,
   ]

# add labels to axes object (requires pymol version 0.8 or greater, I
# believe

cyl_text(obj,plain,[-5.,-5.,-1],'Origin',0.20,axes=[[3,0,0],[0,3,0],[0,0,3]])
cyl_text(obj,plain,[10.,0.,0.],'X',0.20,axes=[[3,0,0],[0,3,0],[0,0,3]])
cyl_text(obj,plain,[0.,10.,0.],'Y',0.20,axes=[[3,0,0],[0,3,0],[0,0,3]])
cyl_text(obj,plain,[0.,0.,10.],'Z',0.20,axes=[[3,0,0],[0,3,0],[0,0,3]])

# then we load it into PyMOL
cmd.load_cgo(obj,'axes')
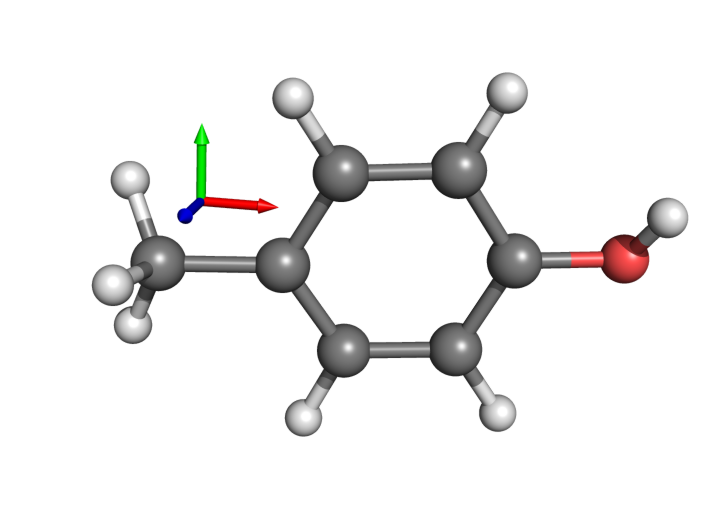
This script draws a simple cartesian coordinate system.
from pymol.cgo import *
from pymol import cmd

w = 0.06 # cylinder width
l = 0.75 # cylinder length
h = 0.25 # cone hight
d = w * 1.618 # cone base diameter

obj = [CYLINDER, 0.0, 0.0, 0.0,   l, 0.0, 0.0, w, 1.0, 0.0, 0.0, 1.0, 0.0, 0.0,
       CYLINDER, 0.0, 0.0, 0.0, 0.0,   l, 0.0, w, 0.0, 1.0, 0.0, 0.0, 1.0, 0.0,
       CYLINDER, 0.0, 0.0, 0.0, 0.0, 0.0,   l, w, 0.0, 0.0, 1.0, 0.0, 0.0, 1.0,
       CONE,   l, 0.0, 0.0, h+l, 0.0, 0.0, d, 0.0, 1.0, 0.0, 0.0, 1.0, 0.0, 0.0, 1.0, 1.0,
       CONE, 0.0,   l, 0.0, 0.0, h+l, 0.0, d, 0.0, 0.0, 1.0, 0.0, 0.0, 1.0, 0.0, 1.0, 1.0,
       CONE, 0.0, 0.0,   l, 0.0, 0.0, h+l, d, 0.0, 0.0, 0.0, 1.0, 0.0, 0.0, 1.0, 1.0, 1.0]

cmd.load_cgo(obj, 'axes')
Save the script and run it in Pymol. Tested in version 1.3.
