This is a read-only mirror of pymolwiki.org
Load new B-factors
Jump to navigation
Jump to search
| Type | Python Script |
|---|---|
| Download | figshare |
| Author(s) | Pietro Gatti-Lafranconi |
| License | CC BY 4.0 |
Introduction
Quick and simple script to replace B-factor values in a PDB structure.
New B-factors are provided in an external .txt file, one per line.
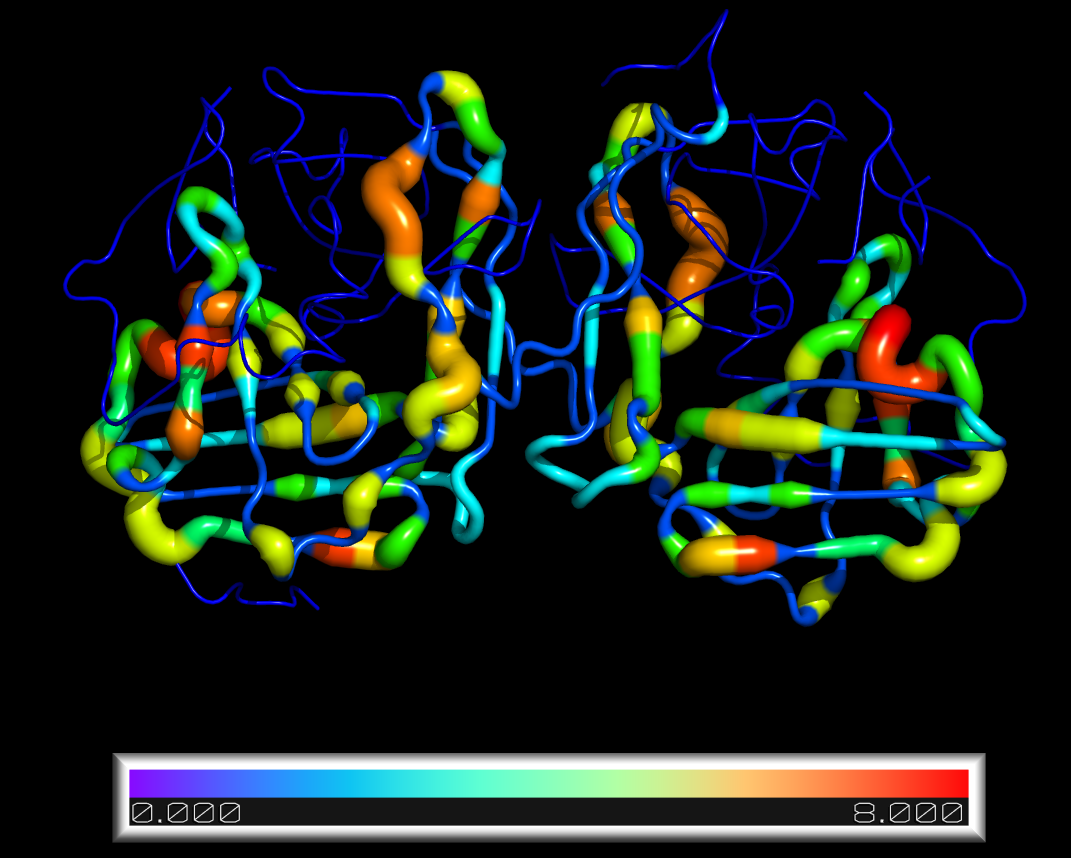
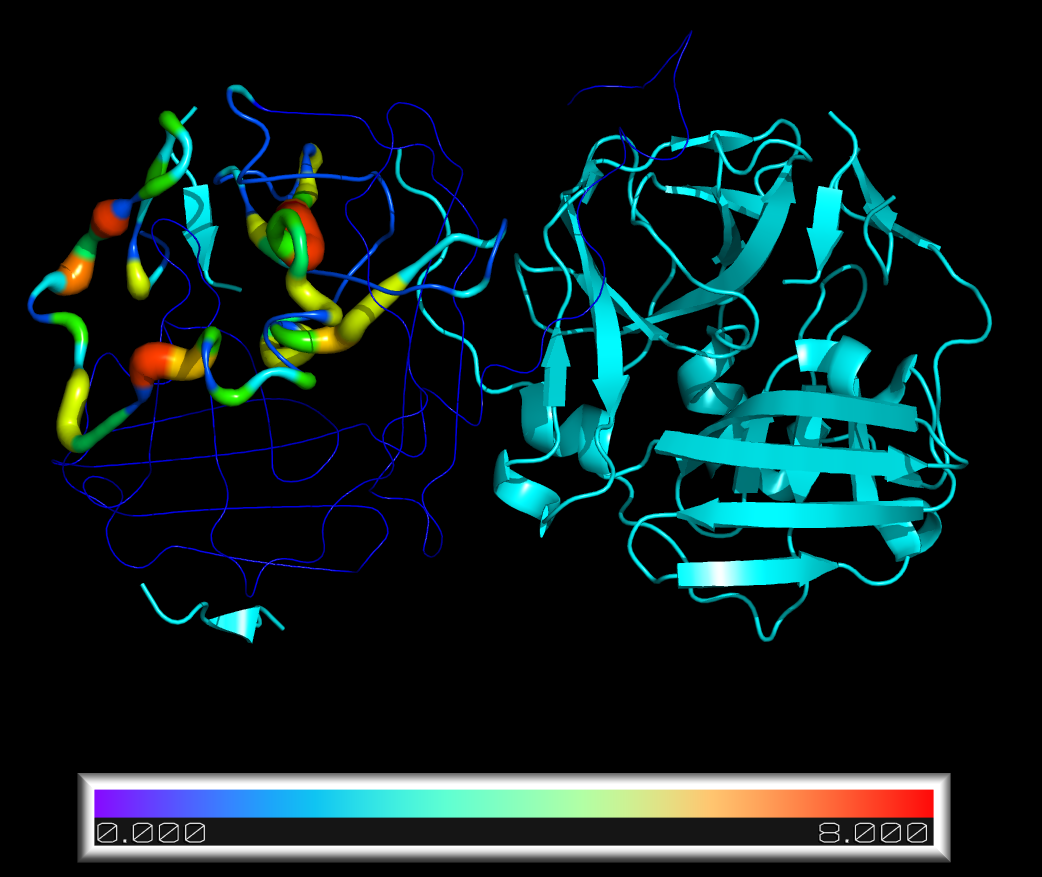
By default, the script will also redraw the selected molecule as cartoon putty and colour by B-factor
Usage
loadBfacts mol, [startaa, [source, [visual Y/N]]]
Required Arguments
- mol = any object selection (within one single object though)
Optional Arguments
- startaa = number of amino acid the first value in 'source' refers to (default=1)
- source = name of the file containing new B-factor values (default=newBfactors.txt)
- visual = redraws structure as cartoon_putty and displays bar with min/max values (default=Y)
Limitations
For its very nature, this script is not suitable for complex cases in which only some B-factors are to be replaced, or on complex selections. In such cases, data2bfactor.py is a better choice.
B-factors have to be entered one per line, with no labels or amino acid ID. They will replace values of a continuous stretch of amino acids of equal length (or shorter) starting from the position provided with 'startaa'.
'newBfactors.txt' looks like
2
0
0
3
7
...
Examples
PyMOL>loadbfacts 1LVM
PyMOL>loadbfacts 1LVM and chain a, startaa=135
The Code
from pymol import cmd, stored, math

def loadBfacts (mol,startaa=1,source="newBfactors.txt", visual="Y"):
	"""
	Replaces B-factors with a list of values contained in a plain txt file

	usage: loadBfacts mol, [startaa, [source, [visual]]]

	mol = any object selection (within one single object though)
	startaa = number of first amino acid in 'new B-factors' file (default=1)
	source = name of the file containing new B-factor values (default=newBfactors.txt)
	visual = redraws structure as cartoon_putty and displays bar with min/max values (default=Y)

	example: loadBfacts 1LVM and chain A
	"""
	obj=cmd.get_object_list(mol)[0]
	cmd.alter(mol,"b=-1.0")
	inFile = open(source, 'r')
	counter=int(startaa)
	bfacts=[]
	for line in inFile.readlines():
		bfact=float(line)
		bfacts.append(bfact)
		cmd.alter("%s and resi %s and n. CA"%(mol,counter), "b=%s"%bfact)
		counter=counter+1
	if visual=="Y":
		cmd.show_as("cartoon",mol)
		cmd.cartoon("putty", mol)
		cmd.set("cartoon_putty_scale_min", min(bfacts),obj)
		cmd.set("cartoon_putty_scale_max", max(bfacts),obj)
		cmd.set("cartoon_putty_transform", 0,obj)
		cmd.set("cartoon_putty_radius", 0.2,obj)
		cmd.spectrum("b","rainbow", "%s and n. CA " %mol)
		cmd.ramp_new("count", obj, [min(bfacts), max(bfacts)], "rainbow")
		cmd.recolor()

cmd.extend("loadBfacts", loadBfacts);

