|
|
| (33 intermediate revisions by one other user not shown) |
| Line 1: |
Line 1: |
| − | == Author == | + | {{Infobox script-repo |
| − | This pymol script is made by Troels Emtekær Linnet
| + | |type = script |
| | + | |filename = rotkit.py |
| | + | |author = [[User:Tlinnet|Troels E. Linnet]] |
| | + | |license = BSD |
| | + | }} |
| | | | |
| | == Introduction == | | == Introduction == |
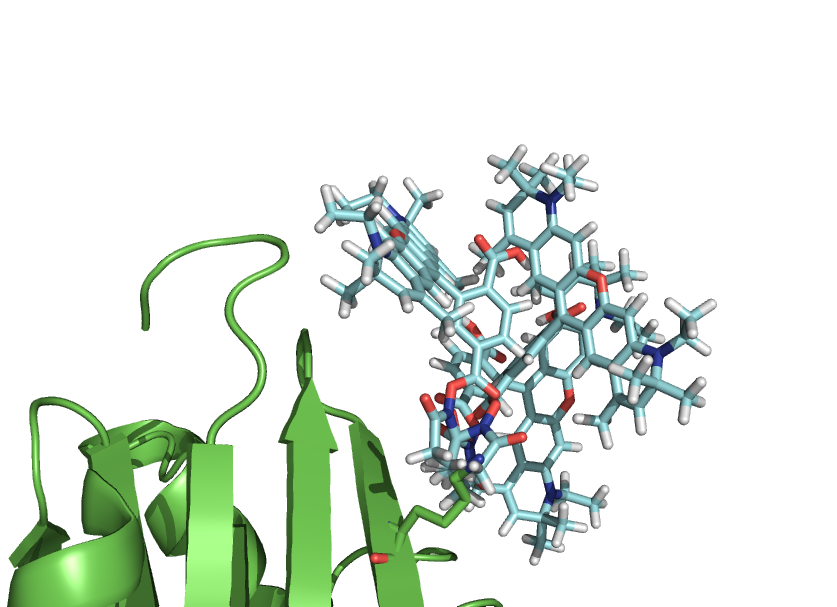
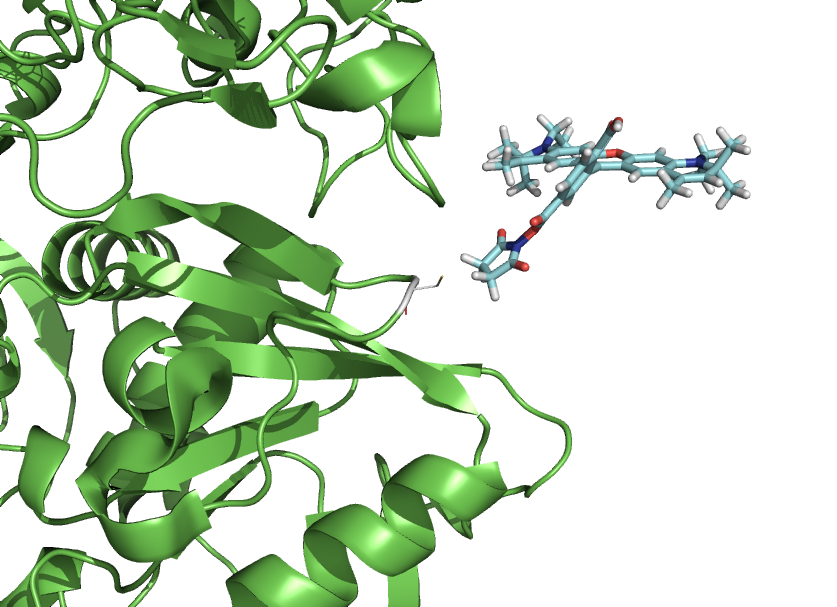
| | This script-kit is a collection of small script to be able to precisely to put a molecule (like a dye) where you want in relation to a protein. | | This script-kit is a collection of small script to be able to precisely to put a molecule (like a dye) where you want in relation to a protein. |
| | + | |
| | + | You can also create rotational states of a domain or simulate a dye freedom. |
| | + | |
| | It simply makes the [[Object_Matrix | PyMOL TTT matrixes]], in a easy and user friendly way. The calls to the functions available in PyMOL, takes care of all the | | It simply makes the [[Object_Matrix | PyMOL TTT matrixes]], in a easy and user friendly way. The calls to the functions available in PyMOL, takes care of all the |
| | conversion of input and such. | | conversion of input and such. |
| Line 9: |
Line 16: |
| | If you are interested in this, you might also want to check out the PyMOL [[Chempy]] module that is included in PyMOL. It provides handy vector and matrix functions. | | If you are interested in this, you might also want to check out the PyMOL [[Chempy]] module that is included in PyMOL. It provides handy vector and matrix functions. |
| | | | |
| − | '''Available in PyMOL'''
| + | === Functions available in PyMOL === |
| | * rotateline(Pos1,Pos2,degangle,molecule): | | * rotateline(Pos1,Pos2,degangle,molecule): |
| | *: "Pos1->Pos2" define a line whereabout "molecule" will be rotated "degangle" degrees | | *: "Pos1->Pos2" define a line whereabout "molecule" will be rotated "degangle" degrees |
| Line 21: |
Line 28: |
| | *: '''toline Pos1=P513C_CA, Pos2=P513C_CB, atom=dyeatom87, molecule=Atto590, dist=3''' | | *: '''toline Pos1=P513C_CA, Pos2=P513C_CB, atom=dyeatom87, molecule=Atto590, dist=3''' |
| | | | |
| − | '''Available through PyMOL mini shell''' | + | '''Available through rotkit.functionname''' |
| | * printMat(matrix): | | * printMat(matrix): |
| | *: prints the TTT matrix in a readable format. (4X4) | | *: prints the TTT matrix in a readable format. (4X4) |
| Line 49: |
Line 56: |
| | | | |
| | == Example of use == | | == Example of use == |
| | + | === Example 1 - Make a rotation of domain === |
| | + | {{Template:PymolScriptRepoDownload|examples/rotkit_1.pml}} |
| | + | <include src="https://raw.github.com/Pymol-Scripts/Pymol-script-repo/master/examples/rotkit_1.pml" highlight="python" /> |
| | | | |
| − | To understand how the script works, read through the tutorial. Unhash "##" each step at the time to see the effect.
| + | === Example 2 - Simulate dye freedom === |
| − | | + | {{Template:PymolScriptRepoDownload|examples/rotkit_2.pml}} |
| − | Note, the python mini shell is important, to get the return values of the functions.
| + | <include src="https://raw.github.com/Pymol-Scripts/Pymol-script-repo/master/examples/rotkit_2.pml" highlight="python" /> |
| − | | |
| − | === The example dye Atto590.pdb file === | |
| − | To be able to follow the examples, you need the dye molecule.
| |
| − | | |
| − | Can be downloaded here: [http://dl.dropbox.com/u/101911/pymol/Atto590.pdb Atto590.pdb]
| |
| − | | |
| − | === The tutorial.pml file ===
| |
| − | <source lang="python"> | |
| − | #-------------------------------------------------------------------------------
| |
| − | # Name: rotkit.py
| |
| − | # Purpose: To rotate molecules easier in pymol
| |
| − | #
| |
| − | # Author: tlinnet
| |
| − | #
| |
| − | # Created: 30/08/2011
| |
| − | # Copyright: (c) tlinnet 2011
| |
| − | # Licence: Free
| |
| − | #-------------------------------------------------------------------------------
| |
| − | | |
| − | cd C:\Users\tlinnet\Documents\My Dropbox\Speciale\5NT-project\Mutant-construct\Distance-Plot
| |
| − | import rotkit
| |
| − | | |
| − | #fetch 1HP1, async=0
| |
| − | load 1HP1.pdb
| |
| − | load Atto590.pdb
| |
| − | | |
| − | ### Get the names of the loaded objects
| |
| − | protname = cmd.get_names()[0]
| |
| − | molname = cmd.get_names()[1]
| |
| − | | |
| − | ### Make the names we are going to use
| |
| − | protselectCB="%s and resi 308 and name CB"%protname
| |
| − | protnameselectCB="K308CB"
| |
| − | protselectCA="%s and resi 308 and name CA"%protname
| |
| − | protnameselectCA="K308CA"
| |
| − | molselect87="%s and id 87"%molname
| |
| − | molnameselect87="dyeatom87"
| |
| − | molselect85="%s and id 85"%molname
| |
| − | molnameselect85="dyeatom85"
| |
| − | | |
| − | ### Make some selections
| |
| − | cmd.select("%s"%protnameselectCB,"%s"%protselectCB)
| |
| − | cmd.select("%s"%protnameselectCA,"%s"%protselectCA)
| |
| − | cmd.select("%s"%molnameselect85,"%s"%molselect85)
| |
| − | cmd.select("%s"%molnameselect87,"%s"%molselect87)
| |
| − | | |
| − | ### Make nice representations
| |
| − | cmd.show_as("cartoon","%s"%protname)
| |
| − | cmd.show("sticks","byres %s"%protnameselectCB)
| |
| − | | |
| − | ##### PART I: Use of functions #####
| |
| − | ### This view will take you to the first part
| |
| − | set_view (\
| |
| − | 0.377224118, 0.880101919, -0.288305759,\
| |
| − | 0.661396861, -0.473919988, -0.581338286,\
| |
| − | -0.648268998, 0.028612033, -0.760871351,\
| |
| − | 0.000000000, 0.000000000, -56.408561707,\
| |
| − | 19.480533600, 34.572898865, 6.978204727,\
| |
| − | 46.615653992, 66.201446533, -20.000001907 )
| |
| − | | |
| − | #### Just unhash each part for itself, as you continue through
| |
| − | #### The python mini shell is important, to get the return values of the functions
| |
| − | | |
| − | ### To print a objects TTT matrix in a readable format
| |
| − | python
| |
| − | rotkit.printMat(cmd.get_object_matrix(molname))
| |
| − | python end
| |
| − | | |
| − | ##### We want to move the dye to a desired location, and rotate it to a view we desire
| |
| − | ##### First get the vector bewteen the dyeatom and the protein atom
| |
| − | ##python
| |
| − | ##diffvector = rotkit.vector("%s"%molselect87,"%s"%protnameselectCB)
| |
| − | ##python end
| |
| − | ##
| |
| − | ##### Then move the dye
| |
| − | ##python
| |
| − | ##move = rotkit.transmat(diffvector)
| |
| − | ##### print the matrix for fun
| |
| − | ##rotkit.printMat(move)
| |
| − | ##### Move the dye
| |
| − | ##cmd.transform_selection("%s"%molname,move)
| |
| − | ##python end
| |
| − | ##
| |
| − | ##### Now we want to displace the dye in the CA-CB bond direction
| |
| − | ##python
| |
| − | ##### First find the vector/direction to displace it in. From A -> B
| |
| − | ##diffvector = rotkit.vector("%s"%protnameselectCA,"%s"%protnameselectCB)
| |
| − | ##### Make the vector so its lenth is equal 1
| |
| − | ##uvector = rotkit.unitvector(diffvector)[0]
| |
| − | ##### Make the move translation matrix, and we multiply the matrix with 3, so it moves 3 Angstrom
| |
| − | ##move = rotkit.transmat(uvector,3)
| |
| − | ##### Print the matrix
| |
| − | ##rotkit.printMat(move)
| |
| − | ##### Displace it in the CA-CB direction
| |
| − | ##cmd.transform_selection("%s"%molname,move)
| |
| − | ##python end
| |
| − | ##
| |
| − | ##### Now we want to rotate it a single time. We convert 40 degress to radians
| |
| − | ##### The input is the angle, the line to rotate around, and a point where the line goes through
| |
| − | ##python
| |
| − | ##CBxyz = rotkit.getxyz("%s"%protnameselectCB)[0]
| |
| − | ##rmat = rotkit.rotmat(rotkit.radangle(40),uvector,CBxyz)
| |
| − | ##rotkit.printMat(rmat)
| |
| − | ##### Copy paste this line into pymol to see it manually
| |
| − | ##cmd.transform_selection("%s"%molname,rmat)
| |
| − | ##python end
| |
| − | ##
| |
| − | ##### We are not quite satisfied, we want to rotate it around its own bond
| |
| − | ##### So we rotate in around its own 87-85 bonds
| |
| − | ##python
| |
| − | ##diffvector = rotkit.vector("%s"%molnameselect87,"%s"%molnameselect85)
| |
| − | ##uvector = rotkit.unitvector(diffvector)[0]
| |
| − | ##xyz85 = rotkit.getxyz("%s"%molnameselect85)[0]
| |
| − | ##rmat = rotkit.rotmat(rotkit.radangle(10),uvector,xyz85)
| |
| − | ##### Copy paste this line into pymol to see it manually
| |
| − | ##cmd.transform_selection("%s"%molname,rmat)
| |
| − | ##python end
| |
| − | ##
| |
| − | ##### Now, lets make a function that collects all these call in one function
| |
| − | ##### We only want to define two positions that defines the line, the angle and the object to rotate
| |
| − | ##python
| |
| − | ##rotkit.rotateline("%s"%molnameselect87,"%s"%molnameselect85,180,"%s"%molname)
| |
| − | ##python end
| |
| − | ##### This is made as a pymol command as well. I first print the names that we should write manually in the consol
| |
| − | ##print("rotateline Pos1=%s, Pos2=%s, degangle=15, molecule=%s"%(molnameselect87, molnameselect85, molname))
| |
| − | ##
| |
| − | ##### To illustate best, we create som copies of the dye
| |
| − | ##python
| |
| − | ##anglerange = range(90,360,90)
| |
| − | ##for angle in anglerange:
| |
| − | ## ### Make a suitable name for the new molecule
| |
| − | ## molanglename="%s%s"%(molname,angle)
| |
| − | ## ### Now make a copy
| |
| − | ## cmd.create(molanglename,molname)
| |
| − | ## ### Rotate the copy
| |
| − | ## rotkit.rotateline("%s"%molnameselect87,"%s"%molnameselect85,angle,"%s"%molanglename)
| |
| − | ##python end
| |
| − | ##
| |
| − | ####### End of PART I ####
| |
| − | ####### PART II: More advanced functions #####
| |
| − | ##### This view will take you to the second part
| |
| − | ##set_view (\
| |
| − | ## 0.723298192, 0.467510879, 0.508201897,\
| |
| − | ## 0.371686131, -0.883831143, 0.284063697,\
| |
| − | ## 0.581970334, -0.016570913, -0.813038886,\
| |
| − | ## 0.000000000, 0.000000000, -76.609786987,\
| |
| − | ## 11.790571213, 64.992294312, 20.803859711,\
| |
| − | ## -31.181428909, 184.401092529, -20.000001907 )
| |
| − | ##
| |
| − | ##### We can fast mutate a protein. frame 1 is the most probable mutation
| |
| − | ##python
| |
| − | ##rotkit.mutate(protname, chain="A", resi=513, target="CYS", mutframe=1)
| |
| − | ##python end
| |
| − | ##### This is made as a pymol command as well. I first print the names that we should write manually in the consol
| |
| − | ##print("mutate %s, chain=%s, resi=%s, target=CYS, mutframe=1"%(protname, "A", 515))
| |
| − | ##
| |
| − | ##### We now make some selections for this mutation
| |
| − | ##protselectCBcys="%s and resi 513 and name CB"%protname
| |
| − | ##protnameselectCBcys="P513C_CB"
| |
| − | ##protselectCAcys="%s and resi 513 and name CA"%protname
| |
| − | ##protnameselectCAcys="P513C_CA"
| |
| − | ##cmd.select("%s"%protnameselectCBcys,"%s"%protselectCBcys)
| |
| − | ##cmd.select("%s"%protnameselectCAcys,"%s"%protselectCAcys)
| |
| − | ##
| |
| − | ##### Now, lets make a function that collects all the commands to put on an atom on the same line defined by two points
| |
| − | ##### The input is the two points that define the line, the atom of a molecule to be put on the line, and the distance to move
| |
| − | ##python
| |
| − | ##rotkit.toline(protnameselectCAcys,protnameselectCBcys,molnameselect87,molname,3)
| |
| − | ##rotkit.rotateline(protnameselectCAcys,protnameselectCBcys,5,molname)
| |
| − | ##rotkit.rotateline(molnameselect87,molnameselect85,10,molname)
| |
| − | ##python end
| |
| − | ##print("toline Pos1=%s, Pos2=%s, atom=%s, molecule=%s, dist=%s"%(protnameselectCAcys,protnameselectCBcys,molnameselect87,molname,3))
| |
| − | ##print("rotateline Pos1=%s, Pos2=%s, degangle=5, molecule=%s"%(protnameselectCAcys, protnameselectCBcys, molname))
| |
| − | ##print("rotateline Pos1=%s, Pos2=%s, degangle=10, molecule=%s"%(molnameselect87, molnameselect85, molname))
| |
| − | ##
| |
| − | ####### End of PART II ####
| |
| − | ####### Now we make a cross product ####
| |
| − | ##molselect88="%s and id 88"%molname
| |
| − | ##molnameselect85="dyeatom88"
| |
| − | ##cmd.select("%s"%molnameselect88,"%s"%molselect88)
| |
| − | ##
| |
| − | ##python
| |
| − | ##cross = rotkit.crossprod(rotkit.vector(molselect87,molselect85),rotkit.vector(molselect87,molselect88))
| |
| − | ###ucross = rotkit.unitvector(cross)[0]
| |
| − | ##pcross = rotkit.crosspoint(molselect87,cross)
| |
| − | ##rotkit.rotateline(molnameselect87,pcross,10,molname)
| |
| − | ##python end
| |
| − | ##print("rotateline Pos1=%s, Pos2=%s, degangle=10, molecule=%s"%(molnameselect87, pcross, molname))
| |
| − | </source>
| |
| − | | |
| − | == rotkit.py ==
| |
| − | The code can be downloaded fast from here http://tinyurl.com/pymolrotkit <br />
| |
| − | # wget http://tinyurl.com/pymolrotkit
| |
| − | # mv pymolrotkit rotkit.py
| |
| − | | |
| − | <source lang="python">
| |
| − | #-------------------------------------------------------------------------------
| |
| − | # Name: rotkit.py examples
| |
| − | # Purpose: To rotate molecules easier
| |
| − | #
| |
| − | # Author: tlinnet
| |
| − | #
| |
| − | # Created: 30/08/2011
| |
| − | # Copyright: (c) tlinnet 2011
| |
| − | # Licence: Free
| |
| − | #-------------------------------------------------------------------------------
| |
| − | | |
| − | | |
| − | from pymol import cmd
| |
| − | import math, os
| |
| − | from time import sleep
| |
| − | | |
| − | def printMat(matrix):
| |
| − | print("%s %s %s %s \n%s %s %s %s \n%s %s %s %s \n%s %s %s %s"%(matrix[0],matrix[1],matrix[2],matrix[3],matrix[4],matrix[5],matrix[6],matrix[7],matrix[8],matrix[9],matrix[10],matrix[11],matrix[12],matrix[13],matrix[14],matrix[15]))
| |
| − | return None
| |
| − | | |
| − | def getxyz(Sel):
| |
| − | if type(Sel)==list and len(Sel)==3:
| |
| − | return Sel, "listXYZ"
| |
| − | if type(Sel)==str and Sel[0]=="[" and Sel[-1]=="]":
| |
| − | Selsplit = list(Sel[1:-1].split(","))
| |
| − | Selsplit = [float(x) for x in Selsplit]
| |
| − | return Selsplit, "strXYZ"
| |
| − | if type(Sel)==str:
| |
| − | pos = cmd.get_atom_coords(Sel)
| |
| − | return pos, "selXYZ"
| |
| − | | |
| − | def vector(Sel1,Sel2):
| |
| − | PosSel1 = getxyz(Sel1)[0]
| |
| − | PosSel2 = getxyz(Sel2)[0]
| |
| − | vectorcalc = [PosSel2[0]-PosSel1[0],PosSel2[1]-PosSel1[1],PosSel2[2]-PosSel1[2]]
| |
| − | return(vectorcalc)
| |
| − | | |
| − | def vectoradd(Sel1,Sel2):
| |
| − | PosSel1 = getxyz(Sel1)[0]
| |
| − | PosSel2 = getxyz(Sel2)[0]
| |
| − | vectorcalc = [PosSel1[0]+PosSel2[0],PosSel1[1]+PosSel2[1],PosSel1[2]+PosSel2[2]]
| |
| − | return(vectorcalc)
| |
| − | | |
| − | def vectorstr(vector):
| |
| − | return("[%s,%s,%s]"%(vector[0],vector[1],vector[2]))
| |
| − | | |
| − | def transmat(vector,dist=1):
| |
| − | mat = [1,0,0,0,0,1,0,0,0,0,1,0,dist*vector[0],dist*vector[1],dist*vector[2],1]
| |
| − | return(mat)
| |
| − | | |
| − | def unitvector(vector):
| |
| − | vectorlen = math.sqrt(math.pow(vector[0],2)+math.pow(vector[1],2)+math.pow(vector[2],2))
| |
| − | vectordiv = [vector[0]/vectorlen, vector[1]/vectorlen, vector[2]/vectorlen]
| |
| − | return(vectordiv,vectorlen)
| |
| − | | |
| − | def radangle(angle):
| |
| − | return(math.radians(angle))
| |
| − | | |
| − | def rotmat(angle,vectornorm,pointcoord):
| |
| − | ### From: http://inside.mines.edu/~gmurray/ArbitraryAxisRotation/ Section 6.2
| |
| − | u,v,w = vectornorm
| |
| − | a,b,c = pointcoord
| |
| − | makerotmat = [(math.pow(u,2)+(math.pow(v,2)+math.pow(w,2))*math.cos(angle)),
| |
| − | (u*v*(1-math.cos(angle))-w*math.sin(angle)),
| |
| − | (u*w*(1-math.cos(angle))+v*math.sin(angle)),
| |
| − | ((a*(math.pow(v,2)+math.pow(w,2))-u*(b*v+c*w))*(1-math.cos(angle))+(b*w-c*v)*math.sin(angle)),
| |
| − | (u*v*(1-math.cos(angle))+w*math.sin(angle)),
| |
| − | (math.pow(v,2)+(math.pow(u,2)+math.pow(w,2))*math.cos(angle)),
| |
| − | (v*w*(1-math.cos(angle))-u*math.sin(angle)),
| |
| − | ((b*(math.pow(u,2)+math.pow(w,2))-v*(a*u+c*w))*(1-math.cos(angle))+(c*u-a*w)*math.sin(angle)),
| |
| − | (u*w*(1-math.cos(angle))-v*math.sin(angle)),
| |
| − | (v*w*(1-math.cos(angle))+u*math.sin(angle)),
| |
| − | (math.pow(w,2)+(math.pow(u,2)+math.pow(v,2))*math.cos(angle)),
| |
| − | ((c*(math.pow(u,2)+math.pow(v,2))-w*(a*u+b*v))*(1-math.cos(angle))+(a*v-b*u)*math.sin(angle)),
| |
| − | (0),(0),(0),(1),]
| |
| − | return(makerotmat)
| |
| − | | |
| − | def rotateline(Pos1,Pos2,degangle,molecule):
| |
| − | diffvector = vector(Pos1,Pos2)
| |
| − | uvector = unitvector(diffvector)[0]
| |
| − | xyz = getxyz(Pos2)[0]
| |
| − | rmat = rotmat(radangle(float(degangle)),uvector,xyz)
| |
| − | cmd.transform_selection(molecule,rmat)
| |
| − | return(None)
| |
| − | cmd.extend("rotateline",rotateline)
| |
| − | | |
| − | def mutate(molecule,chain,resi,target="CYS",mutframe="1"):
| |
| − | target = target.upper()
| |
| − | cmd.wizard("mutagenesis")
| |
| − | cmd.do("refresh_wizard")
| |
| − | cmd.get_wizard().set_mode("%s"%target)
| |
| − | selection="/%s//%s/%s"%(molecule,chain,resi)
| |
| − | cmd.get_wizard().do_select(selection)
| |
| − | cmd.frame(str(mutframe))
| |
| − | cmd.get_wizard().apply()
| |
| − | #cmd.set_wizard("done")
| |
| − | cmd.set_wizard()
| |
| − | #cmd.refresh()
| |
| − | #### Example in pymol
| |
| − | #python
| |
| − | #MutList = [["5NT","A",308],["5NT","A",513],["5NT","B",513]]
| |
| − | #for p,c,r in MutList:
| |
| − | # rotkit.mutate(p, chain=c, resi=r, target="CYS", mutframe=1)
| |
| − | ### Have do mutate first before selecting, or else it only select the lase?
| |
| − | #for p,c,r in MutList:
| |
| − | # cmd.select("%s%s%s"%(p,c,r),"/%s//%s/%s"%((p,c,r)))
| |
| − | #python end
| |
| − | cmd.extend("mutate",mutate)
| |
| − | | |
| − | def toline(Pos1,Pos2,atom,molecule,dist=1):
| |
| − | dist = float(dist)
| |
| − | diffvector = vector(atom,Pos2)
| |
| − | move = transmat(diffvector)
| |
| − | cmd.transform_selection("%s"%molecule,move)
| |
| − | diffvector = vector(Pos1,Pos2)
| |
| − | uvector = unitvector(diffvector)[0]
| |
| − | move = transmat(uvector,dist)
| |
| − | cmd.transform_selection("%s"%molecule,move)
| |
| − | return(None)
| |
| − | cmd.extend("toline",toline)
| |
| − | | |
| − | def crossprod(Vector1, Vector2):
| |
| − | return([Vector1[1]*Vector2[2]-Vector1[2]*Vector2[1], Vector1[2]*Vector2[0]-Vector1[0]*Vector2[2],Vector1[0]*Vector2[1]-Vector1[1]*Vector2[0]])
| |
| − | | |
| − | def crosspoint(Pos1, crossprod):
| |
| − | Imp1 = getxyz(Pos1)[0]
| |
| − | Imp2 = getxyz(crossprod)[0]
| |
| − | return([Imp1[0]+Imp2[0],Imp1[1]+Imp2[1],Imp1[2]+Imp2[2]])
| |
| − |
| |
| − | def VectorToMatrix(Vector,MatColRank=4):
| |
| − | import numpy
| |
| − | nextrow = range(MatColRank,MatColRank**2,MatColRank)
| |
| − | rowsall = []
| |
| − | rowcurrent = []
| |
| − | for i in range(len(Vector)):
| |
| − | if i in nextrow:
| |
| − | rowsall.append(rowcurrent)
| |
| − | rowcurrent=[]
| |
| − | rowcurrent.append(Vector[i])
| |
| − | else:
| |
| − | rowcurrent.append(Vector[i])
| |
| − | print rowsall
| |
| − | return(numpy.matrix(rowsall))
| |
| | | | |
| − | def findMinMax(datalist,index):
| + | === Example 3 - Create distance distribution histogram === |
| − | minimum = datalist[0][index]
| + | {{Template:PymolScriptRepoDownload|examples/rotkit_3.pml}} |
| − | maximum = datalist[0][index]
| + | <include src="https://raw.github.com/Pymol-Scripts/Pymol-script-repo/master/examples/rotkit_3.pml" highlight="python" /> |
| − | datacolumn = []
| |
| − | for l in datalist:
| |
| − | datacolumn.append(l[index])
| |
| − | if l[index] < minimum:
| |
| − | minimum = l[index]
| |
| − | if l[index] > maximum:
| |
| − | maximum = l[index]
| |
| − | return(minimum,maximum,datacolumn)
| |
| − |
| |
| − | def makehistogram(datalist,dataname="Histogram",datalistindex=2,nrbins=100,binrange=[0,0]):
| |
| − | import numpy
| |
| − | fileout_name= "%s"%dataname +".dat"
| |
| − | fileout_write = open(fileout_name, "w")
| |
| − | gnuplot_write = open("%s"%dataname +".plt", "w")
| |
| − | datacolumnMin, datacolumnMax,datacolumn = findMinMax(datalist,datalistindex)
| |
| − | if binrange[1]==0:
| |
| − | xdelta = datacolumnMax-datacolumnMin
| |
| − | binrange[0] = datacolumnMin-xdelta/2
| |
| − | binrange[1] = datacolumnMax+xdelta/2
| |
| − | #print binrange
| |
| − | (n, binval)=numpy.histogram(datacolumn,bins=int(nrbins),range=(binrange[0],binrange[1]),normed=False)
| |
| − | binwidthDist = (binrange[1]-binrange[0])/nrbins
| |
| − | DistHist = []
| |
| − | ### Normalize the histogram
| |
| − | for i in range(len(n)):
| |
| − | DistHist.append([binval[i], n[i],float(n[i])/len(datacolumn)])
| |
| − | #print DistHist
| |
| − | DistHistMin,DistHistMax,tmp = findMinMax(DistHist,2)
| |
| − | #print DistHistMin,DistHistMax
| |
| − | ydelta = DistHistMax-DistHistMin
| |
| − | ### Now write the output
| |
| − | fileout_write.write("#Datapoints=%s"%len(datacolumn) + "\n");
| |
| − | fileout_write.write("#Dist[Ang] Frequency[#] Probability"+ "\n");
| |
| − | for dp in DistHist:
| |
| − | textline = "%4.2f %5i %18.5f"%(dp[0], dp[1], dp[2])
| |
| − | fileout_write.write(textline+"\n")
| |
| − | gnuplot_write.write('cd "%s"'%os.getcwd() + '\n')
| |
| − | gnuplot_write.write('set term postscript eps enhanced color' + '\n')
| |
| − | gnuplot_write.write('' + '\n')
| |
| − | gnuplot_write.write('set style line 1 lt 1 lw 3 linecolor rgb "red"' + '\n')
| |
| − | gnuplot_write.write('set style line 2 lt 1 lw 3 linecolor rgb "green"' + '\n')
| |
| − | gnuplot_write.write('set style line 3 lt 1 lw 3 linecolor rgb "blue"' + '\n')
| |
| − | gnuplot_write.write('set style line 4 lt 1 lw 3 linecolor rgb "pink"' + '\n')
| |
| − | gnuplot_write.write('set style line 5 lt 1 lw 0 linecolor rgb "red"' + '\n')
| |
| − | gnuplot_write.write('binwidthDist=%s'%binwidthDist + '\n')
| |
| − | gnuplot_write.write('set title "Normalized distance histogram"' + '\n')
| |
| − | gnuplot_write.write('set xlabel "Distance [Ang]"' + '\n')
| |
| − | gnuplot_write.write('set xrange[%s:%s]'%(binrange[0],binrange[1]) + '\n')
| |
| − | gnuplot_write.write('set ylabel "Probability"' + '\n')
| |
| − | gnuplot_write.write('set yrange[%s:%s]'%(DistHistMin,DistHistMax/binwidthDist) + '\n')
| |
| − | gnuplot_write.write('set ytics nomirror' + '\n')
| |
| − | gnuplot_write.write('set y2label "Integrated Bin probability"' + '\n')
| |
| − | gnuplot_write.write('set y2range[%s:%s]'%(DistHistMin,DistHistMax) + '\n')
| |
| − | gnuplot_write.write('set y2tics border' + '\n')
| |
| − | gnuplot_write.write('' + '\n')
| |
| − | gnuplot_write.write('A=1' + '\n')
| |
| − | gnuplot_write.write('sigma2=%s'%(xdelta/6.0) + '\n')
| |
| − | gnuplot_write.write('center=%s'%(datacolumnMin+xdelta/2) + '\n')
| |
| − | gnuplot_write.write('g(x) = (A*1.0/sqrt(2*pi*sigma2))*exp(-(x-center)**2/(2*sigma2))' + '\n')
| |
| − | gnuplot_write.write('fit g(x) "%s" using 1:($3/binwidthDist) via sigma2,center'%fileout_name + '\n')
| |
| − | gnuplot_write.write('' + '\n')
| |
| − | gnuplot_write.write('set label "g(x)= A*1/(sqrt(2{/Symbol p}{/Symbol s}^2)) * exp(-(x-{/Symbol m})^2/(2{/Symbol s}^2))" at graph 0.05, graph 0.85' + '\n')
| |
| − | gnuplot_write.write('set label "A= %g", A at graph 0.05, graph 0.80' + '\n')
| |
| − | gnuplot_write.write('set label "{/Symbol s}= %g", sqrt(sigma2) at graph 0.05, graph 0.75' + '\n')
| |
| − | gnuplot_write.write('set label "{/Symbol m}= %g", center at graph 0.05, graph 0.70' + '\n')
| |
| − | gnuplot_write.write('' + '\n')
| |
| − | gnuplot_write.write('set label "Binwidth= %g", binwidthDist at graph 0.05, graph 0.95' + '\n')
| |
| − | gnuplot_write.write('set label "Datapoints= %g", '+'%s'%len(datacolumn) + ' at graph 0.05, graph 0.90' + '\n')
| |
| − | gnuplot_write.write('set output "%s.eps"'%(fileout_name[:-4]) + '\n')
| |
| − | gnuplot_write.write('plot "%s" using 1:($3/binwidthDist) title "%s" with boxes fs solid 0.4 noborder,\\'%(fileout_name,fileout_name[:-4]) + '\n')
| |
| − | gnuplot_write.write('g(x) title "Fitted normal distribution g(x)" lw 4,\\' + '\n')
| |
| − | gnuplot_write.write('"%s" using 1:3 title "" with histeps ls 5 axis x1y2'%fileout_name + '\n')
| |
| | | | |
| − | fileout_write.close()
| + | === Example 4 - A tutorial file === |
| − | gnuplot_write.close()
| + | To understand how the functions works, read through the tutorial. Hash/Unhash "##" each step at the time to see the effect. |
| − | return(DistHist)
| + | To be able to follow the tutorial, you need the dye molecule, which is loaded from the Pymol-script-repository. |
| − | </source>
| |
| | | | |
| | + | {{Template:PymolScriptRepoDownload|examples/rotkit_4.pml}} |
| | + | <include src="https://raw.github.com/Pymol-Scripts/Pymol-script-repo/master/examples/rotkit_4.pml" highlight="python" /> |
| | | | |
| | [[Category:Script_Library]] | | [[Category:Script_Library]] |
| | [[Category:ObjSel_Scripts]] | | [[Category:ObjSel_Scripts]] |
| | + | [[Category:Pymol-script-repo]] |