This is a read-only mirror of pymolwiki.org

Main Page

From PyMOL Wiki
Jump to navigation Jump to search
hosted by SBGridlogo2.jpg
Welcome to the PyMOL Wiki!
The community-run support site for the PyMOL molecular viewer.
To request a new account, email SBGrid at: accounts (@) sbgrid dot org
Quick Links
Tutorials Table of Contents Commands
Script Library Plugins FAQ
Gallery | Covers PyMOL Cheat Sheet (PDF) Getting Help
News & Updates
Official Release PyMOL v2.5 has been released on May 10, 2021.
Python 3 New Python 3 compatibility guide for scripts and plugins
POSF New PyMOL fellows announced for 2018-2019
Tutorial Plugins Tutorial updated for PyQt5
New Plugin PICv is a new plugin for clustering protein-protein interactions and visualization with available data from PDBe
Selection keywords New polymer.protein and polymer.nucleic selection keywords. Thanks everyone who participated in the poll!
Plugin Update MOLE 2.5 is an updated version of channel analysis software in PyMOL
New Script dssr_block is a wrapper for DSSR (3dna) and creates block-shaped nucleic acid cartoons
Older News See Older News.
Did you know...

DynoPlot

Type PyMOL Plugin
Download plugins/dynoplot.py
Author(s) Dan Kulp
License -
This code has been put under version control in the project Pymol-script-repo

Introduction

This script was setup to do generic plotting, that is given a set of data and axis labels it would create a plot. Initially, I had it setup to draw the plot directly in the PyMol window (allowing for both 2D and 3D style plots), but because I couldn't figure out how to billboard CGO objects (Warren told me at the time that it couldn't be done) I took a different approach. The plot now exists in it's own window and can only do 2D plots. It is however interactive. I only have here a Rama.(phi,psi) plot, but the code can be easily extended to other types of data. For instance, I had this working for an energy vs distance data that I had generated by another script.

This script will create a Phi vs Psi(Ramachandran) plot of the selection given. The plot will display data points which can be dragged around Phi,Psi space with the corresponding residue's Phi,Psi angles changing in the ..→
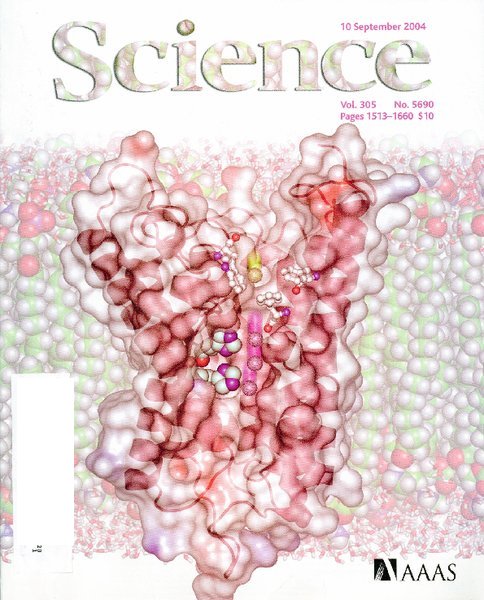
A Random PyMOL-generated Cover. See Covers.