This is a read-only mirror of pymolwiki.org
CMPyMOL
| Type | Software |
|---|---|
| Download | http://emptyewer.github.io/CMPyMOL/ |
| Author(s) | Venkatramanan Krishnamani |
| License | The MIT License (MIT) |
CMPyMOL is an add-on software to molecular visualization program PyMOL. It combines the 3D visualization capabilities of PyMOL and 2D protein contact maps with an interactive interface for scientific analysis. This software is freely distributed under the MIT license for Linux and Mac OS X platforms.
Website
http://emptyewer.github.io/CMPyMOL/
Prerequisites
- Python 2.7
- Python module dependency
- PyMOL executable. It is recommended that the user make sure the directory of installed executable is listed in the $PATH variable.
- Stride executable. This can be downloaded from http://webclu.bio.wzw.tum.de/stride/ and easily compiled into an executable. It is recommemded that the executable or its directory is listed in the system variable $PATH. NOTE: If this executable is not installed properly, the secondary structure calculation will be automatically disabled.
Mac OS X
- Users can install the python libraries using "easy_install" or "pip". It is recommened that the user downloads Enthough Canopy python distribution and management package from https://www.enthought.com/products/canopy/. This package includes a robust python library management software and a python IDE.
- PyMOL 1.5.x can be installed using MacPorts http://www.macports.org. NOTE: This automatically adds the executable into $PATH.
Linux
- The python dependencies and PyMOL can be installed using apt-get (aptitude) or similar package management system.
Installation
There is no need for installation of the script. Optionally, a standalone executable can be complied using "pyinstaller" or "py2exe" or "py2app" packages depending on the users operating system.
Usage
python CMPyMOL.py
- This command will automatically invoke the PyMOL executable and the user is led through the rest of the program with a series of pop-up windows.
Software
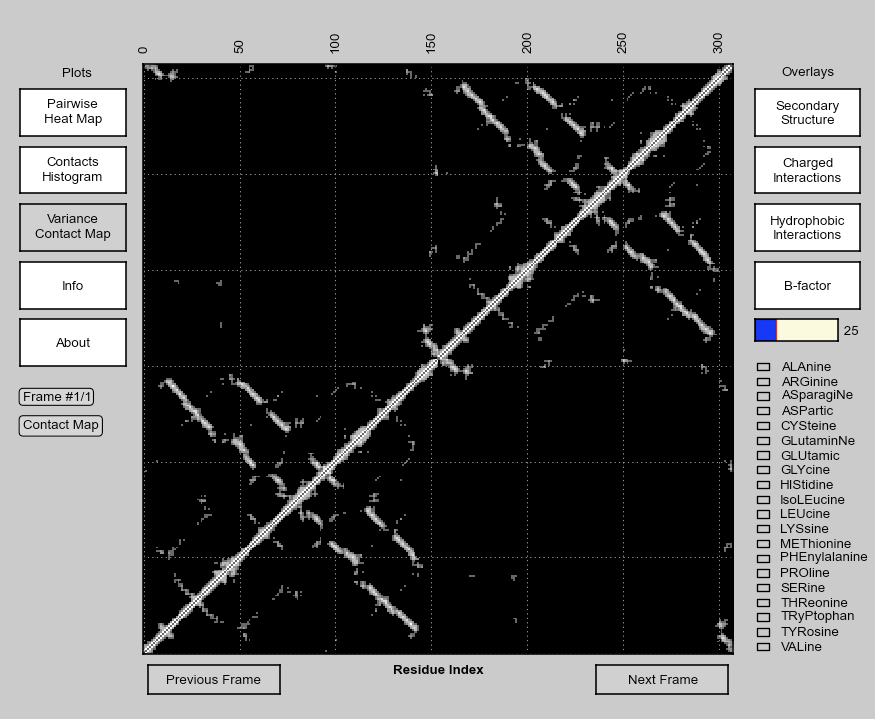
Clicking (left) and draging a selection of points on the displayed contact map will highlight the corresponding residues involved in that contact in the PyMOL window (as red and blue colored spheres). In addition, several structural/biochemical properties can be overlayed on top of the contact map (listed below). The contact-map data can also be plotted in other representations. The calculated contact-map, heat-map and contact density information is now stored in a local SQL database. Any subsequent access of the same PDB with matching parameters will be read from the database for fast access. The code for calculating contact map for trajectory files is parallelized for efficiency.
Inputs
- Single-frame PDB files (local)
- Multi-frame PDB trajectory files (local)
- Multi-frame trajectory files should have the following format. The PDB can include REMARKS, CRYST and other standard information lines about the PDB, but MODEL line is essential for the software to work properly (ENDMDL is optional).
MODEL X
.
.
.
ATOM ...
ATOM ...
.
.
.
ENDMDL
Overlays
- Secondary structure of the protein as translucent strips over the contact map. This button won't be active if secondary structure calculation program stride is not installed. (Button: Secondary Structure)
- Contact points where a Charge-Charge interaction occurs. (Button: Charged Interactions)
- Residues that interact via hydrophobic interaction. (Button: Hydrophobic Interactions)
- Contact regions that have a b-factor that is higher than a certain cutoff (Button: B-factor). The b-factor cutoff can be varied using a slider (Slider).
- Highlights a contact point/region where the selected pair of residues are in contact (selected by checking the checkbox). If only one aminoacid is selected from the list, interaction site of the selected aminoacid with another one of the same type is highlighted. (List of checkboxes for each aminoacid)
Plots
- Pairwise Heat Map - Plots a 20x20 matrix of count of pairwise aminoacid interactions.
- Contacts Histogram - Plots the number of contacts formed by a given residue as a bar graph. Selecting a particular bar highlights the corresponding residue in the PyMOL window.
- Variance Contact Map - For Multi-frame PDB files (trajectory), this button toggles the displays the variance of the contact map starting from the initial frame until the current frame. This is extremely useful in identifying the dynamic regions of a protein.
Requests and Disclaimer
Users are welcome to send me an email to request the addition of a specific feature. I am actively developing this software.
Screenshot
License
#  The MIT License (MIT)
# =======================
#
# The PyMOL Plugin source code in this file is copyrighted, but you are
# free to use and copy it as long as you don't change or remove any of
# the copyright notices.
#
# -----------------------------------------------------------------------------------
# CMPyMOL
# Copyright (C) 2013 by Venkatramanan Krishnamani <venks@andrew.cmu.edu>
#
# Permission is hereby granted, free of charge, to any person obtaining a copy of this
# software and associated documentation files (the "Software"), to deal in the Software
# without restriction, including without limitation the rights to use, copy, modify,
# merge, publish, distribute, sublicense, and/or sell copies of the Software, and to
# permit persons to whom the Software is furnished to do so, subject to the following
# conditions:
#
# The above copyright notice and this permission notice shall be included in all copies
# or substantial portions of the Software.
#
# THE SOFTWARE IS PROVIDED "AS IS", WITHOUT WARRANTY OF ANY KIND, EXPRESS OR IMPLIED,
# INCLUDING BUT NOT LIMITED TO THE WARRANTIES OF MERCHANTABILITY, FITNESS FOR A PARTICULAR
# PURPOSE AND NONINFRINGEMENT. IN NO EVENT SHALL THE AUTHORS OR COPYRIGHT HOLDERS BE
# LIABLE FOR ANY CLAIM, DAMAGES OR OTHER LIABILITY, WHETHER IN AN ACTION OF CONTRACT,
# TORT OR OTHERWISE, ARISING FROM, OUT OF OR IN CONNECTION WITH THE SOFTWARE OR THE USE OR
# OTHER DEALINGS IN THE SOFTWARE.
