This is a read-only mirror of pymolwiki.org
Spectrum
Overview
Spectrum colors atoms with a spectrum of colors based on an atomic property.
Usage
spectrum [expression [, palette [, selection [, minimum [, maximum [, byres ]]]]]]
expression
- count, b, q, or pc: respectively, atom count, temperature factor, occupancy, or partial charge {default: count}
palette
- string: palette name {default: rainbow}
selection
- string: atoms to color {default: (all)}
minimum
- float: {default: None (automatic)}
maximum
- float: {default: None (automatic)}
byres
- integer: controls whether coloring is applied per-residue {default: 0}
Notes
Minimum and maximum are determined automatically unless both arguments are provided and minimum < maximum.
Available palettes include:
- blue_green
- blue_magenta
- blue_red
- blue_white_green
- blue_white_magenta
- blue_white_red
- blue_white_yellow
- blue_yellow
- cbmr
- cyan_magenta
- cyan_red
- cyan_white_magenta
- cyan_white_red
- cyan_white_yellow
- cyan_yellow
- gcbmry
- green_blue
- green_magenta
- green_red
- green_white_blue
- green_white_magenta
- green_white_red
- green_white_yellow
- green_yellow
- green_yellow_red
- magenta_blue
- magenta_cyan
- magenta_green
- magenta_white_blue
- magenta_white_cyan
- magenta_white_green
- magenta_white_yellow
- magenta_yellow
- rainbow
- rainbow2
- rainbow2_rev
- rainbow_cycle
- rainbow_cycle_rev
- rainbow_rev red_blue
- red_cyan red_green
- red_white_blue
- red_white_cyan
- red_white_green
- red_white_yellow
- red_yellow
- red_yellow_green
- rmbc
- yellow_blue
- yellow_cyan
- yellow_cyan_white
- yellow_green
- yellow_magenta
- yellow_red
- yellow_white_blue
- yellow_white_green
- yellow_white_magenta
- yellow_white_red
- yrmbcg
Examples
Simple
spectrum b, blue_red, minimum=10, maximum=50

spectrum count, rainbow_rev, chain A, byres=1
Intermediate
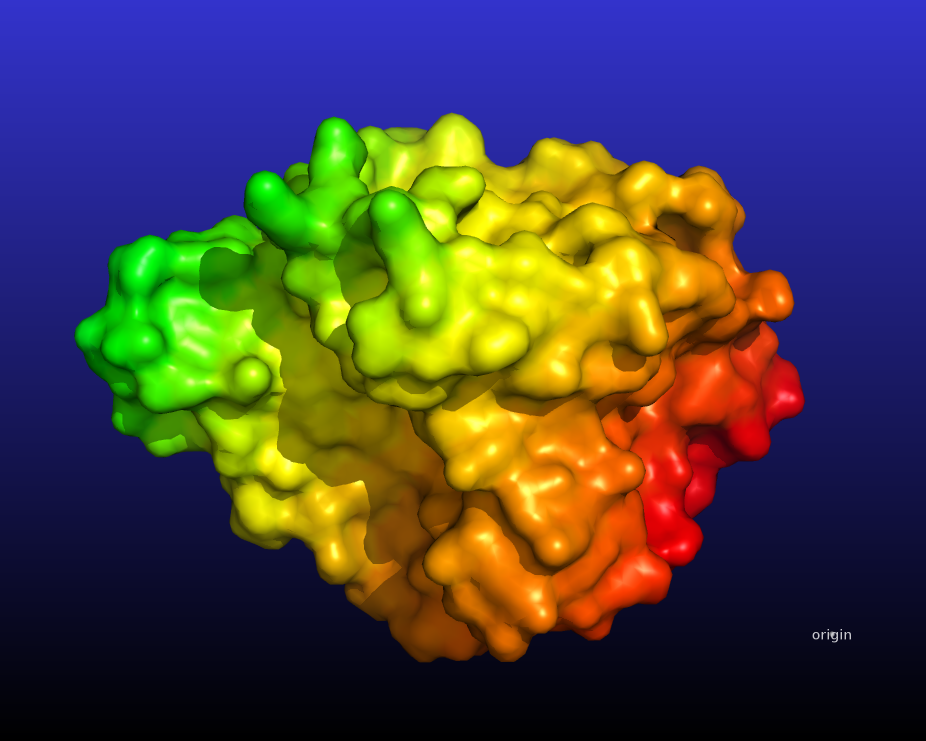
The following script will create this image:
# color atoms based on their distance from a point
# returns the length of the distance between atom A and atom B

diff_len = lambda x,y : math.sqrt((x[0]-y[0])*(x[0]-y[0]) + (x[1]-y[1])*(x[1]-y[1]) + (x[2]-y[2])*(x[2]-y[2]))

# fetch 1hug from the PDB

fetch 1hug, async=0

# show it as surface

as surface

# create the pseudoatom at the origin

pseudoatom pOrig, pos=(0,0,0), label=origin

# these are special PyMOL variables that will hold # the coordinates of
# the atoms and the  pseudoatom

stored.origCoord = []
stored.distCoord = []

# copy the coordinates into those special variables

iterate_state 1, pOrig, stored.origCoord.append((x,y,z))
iterate_state 1, 1hug, stored.distCoord.append((x,y,z))

# extend origCoord to be the same length as the other

stored.origCoord *= len(stored.distCoord)

# calculate the distances

newB = map(lambda x,y: diff_len(x,y), stored.distCoord, stored.origCoord)

# put them into the b-factor of the protein

alter 1hug, b=newB.pop(0)

# color by rainbow_rev or any other
# palette listed in "help spectrum"

spectrum b, rainbow_rev, 1hug

