This is a read-only mirror of pymolwiki.org
Difference between revisions of "Displaying Biochemical Properties"
| Line 199: | Line 199: | ||
[[Image:solvent-accessible_surface.jpg|thumb|Solvent-Accessible Surface Example|right]] | [[Image:solvent-accessible_surface.jpg|thumb|Solvent-Accessible Surface Example|right]] | ||
| − | Note that to display both the molecular surface and the solvent-accessible surface, the object must be duplicated, as is done for [[ | + | Note that to display both the molecular surface and the solvent-accessible surface, the object must be duplicated, as is done for [[===Representation-independent Color Control===]]. This also applies if the spheres representation is to be used to display "real" atoms. |
===Contact Potential=== | ===Contact Potential=== | ||
Revision as of 18:46, 4 December 2009
Selecting secondary structures
A few examples:
select helix, (ss h)
select sheet, (ss s)
select loop, (ss l+'')
Manually Assigning Secondary Structure
You can manually assign secondary stuctures to your protein by
alter 96-103/, ss='S'
alter 96-103/, ss='H'
alter 96-103/, ss='L'
to set residues 96-103 to beta Strand, alpha Helix, and Loop respectively.
See Also
FAQ Displaying Biochemical Properties
Coloring
See also Category:Coloring.
Color by atom type from a script
See Color for this.
Assign color by B-factor
See section Color for this.
Representation-independent color control
See section Surface.
Bonds
PyMOL can deduce bonds from the PDB structure file, even if the CONECT records are missing. In fact, PyMOL guesses bonding connectivity based on proximity, based on the empirical observation that two atoms of a given radius will not be generally closer than a certain distance unless they are bonded.
Displaying double bonds
You can go into the lines mode and turning on the valence display:
hide
as lines
set valence, 0.1
A higher value for valence spreads things out more. I don't know of a way to get the dotted notation.
Hydrogen bonds and Polar Contacts
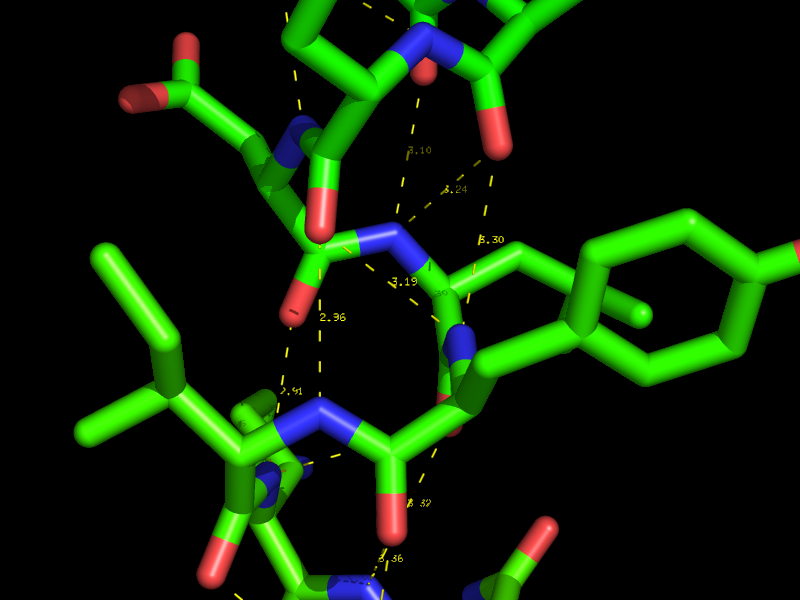
Using the actions [A] button for an object or selection you can display Hydrogen bonds and Polar Contacts. [A]->find->polar contacts-><select from menu>
The command behind the menus is the distance command called with the additional argument mode=2.
Parameters that control the the identification of H-bonds are defined as
set h_bond_cutoff_center, 3.6
with ideal geometry and
set h_bond_cutoff_edge, 3.2
with minimally acceptable geometry.
These settings can be changed *before* running the detection process (dist command mode=2 or via the menus).
Note that the hydrogen bond geometric criteria used in PyMOL was designed to emulate that used by DSSP.
Hydrogen bonds between specific atoms
dist name, sele1, sele2, mode=2
Hydrogen bonds where find->polar contacts doesn't do what you need
You can show H-bonds between two objects using atom selections so long as hydrogens are present in both molecules. If you don't have hydrogens, you can use h_add on the proteins, or provide ligands with valence information and then use h_add.
Two examples are below. For clarity, they draw dashes between the heavy atoms and hide the hydrogens.
# EXAMPLE 1: Show hydrogen bonds between protein
# and docked ligands (which must have hydrogens)

load target.pdb,prot
load docked_ligs.sdf,lig

# add hydrogens to protein

h_add prot

select don, (elem n,o and (neighbor hydro))
select acc, (elem o or (elem n and not (neighbor hydro)))
dist HBA, (lig and acc),(prot and don), 3.2
dist HBD, (lig and don),(prot and acc), 3.2
delete don
delete acc
hide (hydro)

hide labels,HBA
hide labels,HBD
# EXAMPLE 2
# Show hydrogen bonds between two proteins

load prot1.pdb
load prot2.pdb

h_add prot1
h_add prot2

select don, (elem n,o and (neighbor hydro))
select acc, (elem o or (elem n and not (neighbor hydro)))
dist HBA, (prot1 and acc),(prot2 and don), 3.2
dist HBD, (prot1 and don),(prot2 and acc), 3.2
delete don
delete acc
hide (hydro)

hide labels,HBA
hide labels,HBD

# NOTE: that you could also use this approach between two
# non-overlapping selections within a single object.
There is also a script drawing nice hydrogen bonds from Gareth Stockwell.
The "polar contacts" mentioned above are probably better at finding hydrogen bonds than these scripts. "Polar contacts" check geometry as well as distance.
Calculating dihedral angles
The get_dihedral function requires four single-atom selections to work:
get_dihedral prot1///9/C, prot1///10/N, prot1///10/CA, prot1///10/C
Cavities
See Surfaces_and_Voids. Also Caver and CASTp.
Surface-Related
Surface Area
To calculate the surface area of a selection, see Get_Area.
Polar surface area
For a solvent accessible PSA approximation:
set dot_density, 3
remove hydro
remove solvent
show dots
set dot_solvent, on
get_area elem N+O
get_area elem C+S
get_area all
For molecular PSA approximation
set dot_density, 3
remove hydro
remove solvent
set dot_solvent, off
get_area elem N+O
get_area elem C+S
get_area all
Showing dots isn't mandatory, but it's a good idea to confirm that you're getting the value for the atom dot surface you think you're using. Please realize that the resulting numbers are only approximate, reflecting the sum of partial surface areas for all the dots you see. To increase accuracy, set dot_density to 4, but be prepared to wait...
Display solvent accessible surface
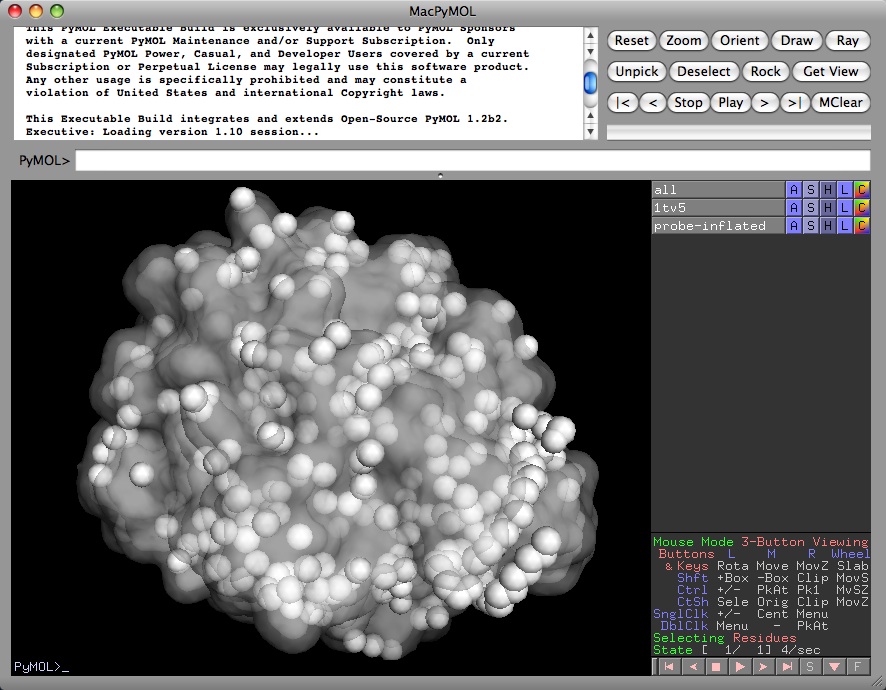
Using the surface display mode, PyMOL doesn't show the solvent accessible surface, rather it shows the solvent/protein contact surface. The solvent accessible surface area is usually defined as the surface traced out by the center of a water sphere, having a radius of about 1.4 angstroms, rolled over the protein atoms. The contact surface is the surface traced out by the vdw surfaces of the water atoms when in contact with the protein.
PyMOL can show solvent accessible surfaces using the dot or sphere representations:
for dots:
show dots
set dot_mode,1
set dot_density,3
for spheres:
alter all,vdw=vdw+1.4
show spheres
Once the Van der Waals radii for the selection have been altered, the surface representation will also be "probe-inflated" to show a pseudo solvent accessible surface, as detailed above.
for surfaces:
alter all,vdw=vdw+1.4
show surface
Note that to display both the molecular surface and the solvent-accessible surface, the object must be duplicated, as is done for ===Representation-independent Color Control===. This also applies if the spheres representation is to be used to display "real" atoms.
Contact Potential
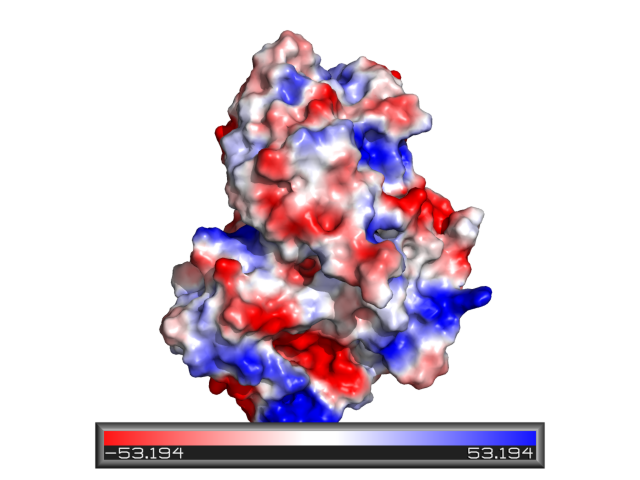
See Protein_contact_potential and APBS.
Residues with functional groups
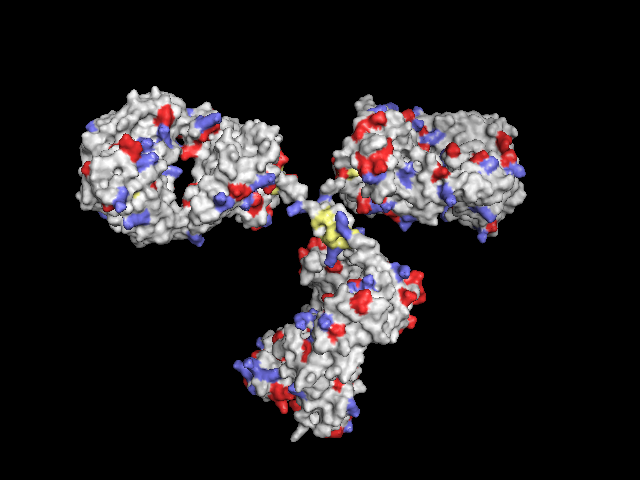
Poor man's solution: Display protein as surface, colorize all Lys (-NH2), Asp and Glu (-COOH) and Cys (-SH):
remove resn hoh    # remove water
h_add              # add hydrogens

as surface
color grey90

color slate, resn lys       # lysines in light blue
color paleyellow, resn cys  # cysteines in light yellow
color tv_red, (resn asp or(resn glu))  # aspartic and glutamic acid in light red
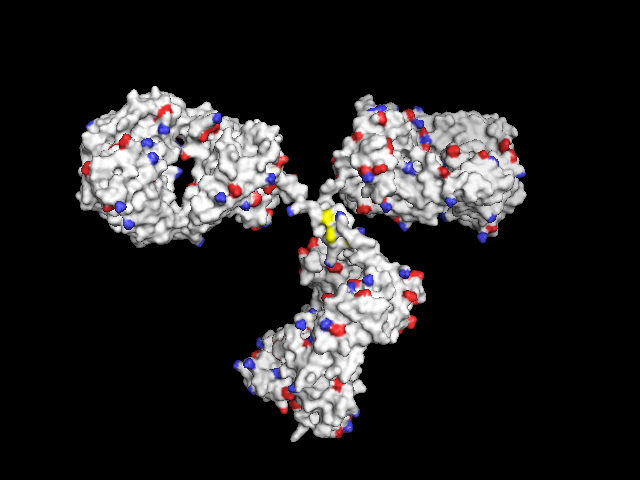
Not-so-poor-man's solution: In order to have the functional groups better localized, only the central atoms can be colored:
- the S atom of cystein,
- the N and H atoms of the free amine of lysine (may be displayed with three H atoms at all three possible positions)
- the C and two O atoms of free carboxylic groups in aspartic and glutamic acid
In this way, they are better visible through the surface compared to only one colored atom, both amines and carboxylic groups consist of three colored atoms each.
remove resn hoh    # remove water
h_add              # add hydrogens

as surface
color grey90

select sulf_cys, (resn cys and (elem C))      # get the sulfur atom of cystein residues
color yellow, sulf_cys

select nitro_lys, (resn lys and name NZ)              # get the nitrogens of free amines ("NZ" in PDB file)
select hydro_lys, (elem H and (neighbor nitro_lys))   # get the neighboring H atoms
select amine_lys, (nitro_lys or hydro_lys)
color tv_blue, amine_lys


select oxy_asp, (resn asp and (name OD1 or name OD2))             # get the two oxygens of -COOH  ("OD1", "OD2")
select carb_asp, (resn asp and (elem C and (neighbor oxy_asp)))   # get the connecting C atom
select oxy_glu, (resn glu and (name OE1 or name OE2))             # oxygens "OE1" and "OE2" in PDB file
select carb_glu, (resn glu and (elem c and (neighbor oxy_glu)))
select carboxy, (carb_asp or oxy_asp or carb_glu or oxy_glu)
color tv_red, carboxy
By displaying the protein as non-transparent surface, only the functional groups (colored atoms) at the surface are visible. The visualization of those groups can be pronounced by displaying the corresponding atoms as spheres, e.g. "as spheres, carboxy + amine_lys + sulf_cys", in this way it might become more clear how accessible they are.
When displaying the protein as cartoon, the functional groups can be shown as spheres, and the whole residues cys, lys, asp and glu as sticks connected to the backbone, with the atoms of the functional groups again as spheres. However, then also the not accessible residues inside the protein are visible.
Backbones
Displaying the C-Alpha trace of proteins
hide
show ribbon
set ribbon_sampling,1
And if your model only contains CA atoms, you'll also need to issue:
set ribbon_trace,1
Displaying the Amino Acid Backbone
The easiest way to see the backbone of the protein is to do
hide all
show ribbon
If you don't like the ribbon representation, you can also do something like
hide all
show sticks, name C+O+N+CA
You can replace sticks in the above by other representations like spheres or lines.
Displaying the Phosphate backbone of nucleic acids
Native Nucleic Acid Rendering in PyMol
PyMol now better supports viewing nucleic acid structure. Nuccyl still seems to be the reigning champ for image quality, but see PyMol's native Cartoon command. For more information on representing nucleic acids, please see the Nucleic Acids Category.
Should you ever want to show the phosphate trace of a nucleic acid molecule:
def p_trace(selection="(all)"):
    s = str(selection)
    cmd.hide('lines',"("+s+")")
    cmd.hide('spheres',"("+s+")")
    cmd.hide('sticks',"("+s+")")
    cmd.hide('ribbon',"("+s+")")
    cmd.show('cartoon',"("+s+")")
    cmd.set('cartoon_sampling',1,"("+s+")")
    cmd.set('cartoon_tube_radius',0.5,"("+s+")")
cmd.extend('p_trace',p_trace)
and then:
p_trace (selection)
Align proteins with CA fit
If two proteins have significant homology, you can use the Align command:
align prot1////ca,prot2
which will perform a sequence alignment of prot1 against prot2, and then an optimizing fit using the CA positions. I'm not sure if the help text for align got into 0.82, but the next version will definitely have it.
