This is a read-only mirror of pymolwiki.org
Difference between revisions of "DynoPlot"
m |
(general overhaul of the script) |
||
| Line 45: | Line 45: | ||
DynoPlot.py | DynoPlot.py | ||
<source lang="python"> | <source lang="python"> | ||
| − | |||
############################################### | ############################################### | ||
# File: DynoPlot.py | # File: DynoPlot.py | ||
# Author: Dan Kulp | # Author: Dan Kulp | ||
# Creation Date: 8/29/05 | # Creation Date: 8/29/05 | ||
| + | # | ||
| + | # Modified 2011-09-20 by Thomas Holder | ||
# | # | ||
# Notes: | # Notes: | ||
| Line 60: | Line 61: | ||
from __future__ import generators | from __future__ import generators | ||
| − | |||
import Tkinter | import Tkinter | ||
| − | |||
| − | |||
| − | |||
| − | |||
from pymol import cmd | from pymol import cmd | ||
| − | + | # workaround: Set to True if nothing gets drawn on canvas, for example on linux with "pymol -x" | |
| − | + | with_mainloop = False | |
| − | |||
| − | |||
| − | |||
| − | |||
| − | |||
| − | |||
| − | |||
class SimplePlot(Tkinter.Canvas): | class SimplePlot(Tkinter.Canvas): | ||
| − | + | # Class variables | |
| − | + | mark = 'Oval' # Only 'Oval' for now.. | |
| − | + | mark_size = 4 | |
| − | |||
| − | |||
| − | |||
| − | |||
| − | |||
| − | |||
| − | |||
| − | |||
| − | |||
| − | |||
| − | |||
| − | + | def __init__(self, *args, **kwargs): | |
| + | Tkinter.Canvas.__init__(self, *args, **kwargs) | ||
| + | self.xlabels = [] # axis labels | ||
| + | self.ylabels = [] | ||
| + | self.spacingx = 0 # spacing in x direction | ||
| + | self.spacingy = 0 | ||
| + | self.xmin = 0 # min value from each axis | ||
| + | self.ymin = 0 | ||
| + | self.lastx = 0 # previous x,y pos of mouse | ||
| + | self.lasty = 0 | ||
| + | self.isdown = 0 # flag for mouse pressed | ||
| + | self.item = (0,) # items array used for clickable events | ||
| + | self.shapes = {} # store plot data, x,y etc.. | ||
| + | self.idx2resn = {} # residue name mapping | ||
| − | + | def axis(self,xmin=40,xmax=300,ymin=10,ymax=290,xint=290,yint=40,xlabels=[],ylabels=[]): | |
| − | |||
| − | |||
| − | |||
| − | |||
| − | |||
| − | |||
| − | + | # Store variables in self object | |
| − | + | self.xlabels = xlabels | |
| − | + | self.ylabels = ylabels | |
| + | self.spacingx = (xmax-xmin) / (len(xlabels) - 1) | ||
| + | self.spacingy = (ymax-ymin) / (len(ylabels) - 1) | ||
| + | self.xmin = xmin | ||
| + | self.ymin = ymin | ||
| − | + | # Create axis lines | |
| − | + | self.create_line((xmin,xint,xmax,xint),fill="black",width=3) | |
| − | + | self.create_line((yint,ymin,yint,ymax),fill="black",width=3) | |
| − | |||
| − | |||
| − | |||
| − | |||
| − | |||
| − | |||
| + | # Create tick marks and labels | ||
| + | nextspot = xmin | ||
| + | for label in xlabels: | ||
| + | self.create_line((nextspot, xint+5,nextspot, xint-5),fill="black",width=2) | ||
| + | self.create_text(nextspot, xint-15, text=label) | ||
| + | if len(xlabels) == 1: | ||
| + | nextspot = xmax | ||
| + | else: | ||
| + | nextspot += (xmax - xmin)/ (len(xlabels) - 1) | ||
| − | |||
| − | |||
| − | |||
| − | |||
| − | |||
| − | |||
| − | |||
| − | |||
| + | nextspot = ymax | ||
| + | for label in ylabels: | ||
| + | self.create_line((yint+5,nextspot,yint-5,nextspot),fill="black",width=2) | ||
| + | self.create_text(yint-20,nextspot,text=label) | ||
| + | if len(ylabels) == 1: | ||
| + | nextspot = ymin | ||
| + | else: | ||
| + | nextspot -= (ymax - ymin)/ (len(ylabels) - 1) | ||
| − | |||
| − | |||
| − | + | # Plot a point | |
| − | + | def plot(self,xp,yp,meta): | |
| − | |||
| − | + | # Convert from 'label' space to 'pixel' space | |
| − | + | x = self.convertToPixel("X",xp) | |
| + | y = self.convertToPixel("Y",yp) | ||
| − | + | resn = self.idx2resn.get(meta) | |
| + | mark = {'GLY': 'Tri', 'PRO': 'Rect'}.get(resn, self.mark) | ||
| + | if mark == 'Oval': | ||
| + | create_shape = self.create_oval | ||
| + | coords = [x-self.mark_size, y-self.mark_size, | ||
| + | x+self.mark_size, y+self.mark_size] | ||
| + | elif mark == 'Tri': | ||
| + | create_shape = self.create_polygon | ||
| + | coords = [x, y-self.mark_size, | ||
| + | x+self.mark_size, y+self.mark_size, | ||
| + | x-self.mark_size, y+self.mark_size] | ||
| + | else: | ||
| + | create_shape = self.create_rectangle | ||
| + | coords = [x-self.mark_size, y-self.mark_size, | ||
| + | x+self.mark_size, y+self.mark_size] | ||
| − | + | oval = create_shape(*coords, | |
| − | + | width=1, outline="black", fill="SkyBlue2") | |
| − | + | self.shapes[oval] = [x,y,0,xp,yp,meta] | |
| − | |||
| − | |||
| − | |||
| − | + | # Convert from pixel space to label space | |
| − | + | def convertToLabel(self,axis, value): | |
| − | + | # Defaultly use X-axis info | |
| − | + | label0 = self.xlabels[0] | |
| − | + | label1 = self.xlabels[1] | |
| − | + | spacing = self.spacingx | |
| − | + | min = self.xmin | |
| − | + | # Set info for Y-axis use | |
| − | + | if axis == "Y": | |
| − | + | label0 = self.ylabels[0] | |
| − | + | label1 = self.ylabels[1] | |
| − | + | spacing = self.spacingy | |
| − | + | min = self.ymin | |
| − | + | pixel = value - min | |
| − | + | label = pixel / spacing | |
| − | + | label = label0 + label * abs(label1 - label0) | |
| − | + | if axis == "Y": | |
| − | + | label = - label | |
| − | + | return label | |
| − | + | # Converts value from 'label' space to 'pixel' space | |
| − | + | def convertToPixel(self,axis, value): | |
| − | + | # Defaultly use X-axis info | |
| − | + | label0 = self.xlabels[0] | |
| − | + | label1 = self.xlabels[1] | |
| − | + | spacing = self.spacingx | |
| − | + | min = self.xmin | |
| − | + | # Set info for Y-axis use | |
| − | + | if axis == "Y": | |
| − | + | label0 = self.ylabels[0] | |
| − | + | label1 = self.ylabels[1] | |
| − | + | spacing = self.spacingy | |
| − | + | min = self.ymin | |
| + | # Get axis increment in 'label' space | ||
| + | inc = abs(label1 - label0) | ||
| − | + | # 'Label' difference from value and smallest label (label0) | |
| − | + | diff = float(value - label0) | |
| − | + | # Get whole number in 'label' space | |
| − | + | whole = int(diff / inc) | |
| − | + | # Get fraction number in 'label' space | |
| − | + | part = float(float(diff/inc) - whole) | |
| − | + | # Return 'pixel' position value | |
| − | + | pixel = whole * spacing + part * spacing | |
| − | + | # Reverse number by subtracting total number of pixels - value pixels | |
| − | + | if axis == "Y": | |
| + | tot_label_diff = float(self.ylabels[-1] - label0) | ||
| + | tot_label_whole = int(tot_label_diff / inc) | ||
| + | tot_label_part = float(float(tot_label_diff / inc) - tot_label_whole) | ||
| + | tot_label_pix = tot_label_whole * spacing + tot_label_part *spacing | ||
| − | + | pixel = tot_label_pix - pixel | |
| − | + | # Add min edge pixels | |
| − | + | pixel = pixel + min | |
| − | |||
| − | |||
| − | |||
| − | |||
| − | + | return pixel | |
| − | |||
| − | |||
| − | + | # Print out which data point you just clicked on.. | |
| + | def pickWhich(self,event): | ||
| + | # Find closest data point | ||
| + | x = event.widget.canvasx(event.x) | ||
| + | y = event.widget.canvasx(event.y) | ||
| + | spot = event.widget.find_closest(x,y) | ||
| − | # Print | + | # Print the shape's meta information corresponding with the shape that was picked |
| − | + | if spot[0] in self.shapes: | |
| + | cmd.select('sele', '(%s`%d)' % self.shapes[spot[0]][5]) | ||
| + | cmd.iterate('sele', 'print " You clicked /%s/%s/%s/%s`%s/%s (DynoPlot)" %' + \ | ||
| + | ' (model, segi, chain, resn, resi, name)') | ||
| + | cmd.center('byres sele', animate=1) | ||
| − | + | # Mouse Down Event | |
| − | + | def down(self,event): | |
| − | |||
| − | |||
| − | + | # Store x,y position | |
| − | + | self.lastx = event.x | |
| − | + | self.lasty = event.y | |
| + | # Find the currently selected item | ||
| + | x = event.widget.canvasx(event.x) | ||
| + | y = event.widget.canvasx(event.y) | ||
| + | self.item = event.widget.find_closest(x,y) | ||
| − | # | + | # Identify that the mouse is down |
| − | + | self.isdown = 1 | |
| − | + | # Mouse Up Event | |
| − | + | def up(self,event): | |
| − | |||
| − | + | # Get label space version of x,y | |
| − | + | labelx = self.convertToLabel("X",event.x) | |
| − | + | labely = self.convertToLabel("Y",event.y) | |
| − | |||
| − | + | # Convert new position into label space.. | |
| − | self. | + | if self.item[0] in self.shapes: |
| + | self.shapes[self.item[0]][0] = event.x | ||
| + | self.shapes[self.item[0]][1] = event.y | ||
| + | self.shapes[self.item[0]][2] = 1 | ||
| + | self.shapes[self.item[0]][3] = labelx | ||
| + | self.shapes[self.item[0]][4] = labely | ||
| − | # | + | # Reset Flags |
| − | + | self.item = (0,) | |
| + | self.isdown = 0 | ||
| − | + | # Mouse Drag(Move) Event | |
| − | + | def drag(self,event): | |
| − | |||
| − | + | # Check that mouse is down and item clicked is a valid data point | |
| − | + | if self.isdown and self.item[0] in self.shapes: | |
| − | |||
| − | |||
| − | |||
| − | |||
| − | |||
| − | + | self.move(self.item, event.x - self.lastx, event.y - self.lasty) | |
| − | self.item | ||
| − | |||
| + | self.lastx = event.x | ||
| + | self.lasty = event.y | ||
| − | # | + | def set_phipsi(model, index, phi, psi): |
| − | + | atsele = [ | |
| + | 'first ((%s`%d) extend 2 and name C)' % (model, index), # prev C | ||
| + | 'first ((%s`%d) extend 1 and name N)' % (model, index), # this N | ||
| + | '(%s`%d)' % (model, index), # this CA | ||
| + | 'last ((%s`%d) extend 1 and name C)' % (model, index), # this C | ||
| + | 'last ((%s`%d) extend 2 and name N)' % (model, index), # next N | ||
| + | ] | ||
| + | try: | ||
| + | cmd.set_dihedral(atsele[0], atsele[1], atsele[2], atsele[3], phi) | ||
| + | cmd.set_dihedral(atsele[1], atsele[2], atsele[3], atsele[4], psi) | ||
| + | except: | ||
| + | print ' DynoPlot Error: cmd.set_dihedral failed' | ||
| − | + | # New Callback object, so that we can update the structure when phi,psi points are moved. | |
| − | + | class DynoRamaObject: | |
| − | + | def __init__(self, selection=None, name=None): | |
| − | + | from pymol import _ext_gui as pmgapp | |
| − | + | if pmgapp is not None: | |
| − | + | import Pmw | |
| − | + | rootframe = Pmw.MegaToplevel(pmgapp.root) | |
| − | + | parent = rootframe.interior() | |
| − | + | else: | |
| − | + | rootframe = Tkinter.Tk() | |
| − | + | parent = rootframe | |
| − | |||
| − | |||
| − | |||
| − | |||
| − | |||
| − | |||
| − | |||
| − | |||
| − | |||
| − | |||
| − | |||
| − | |||
| − | |||
| − | |||
| − | |||
rootframe.title(' Dynamic Angle Plotting ') | rootframe.title(' Dynamic Angle Plotting ') | ||
| − | rootframe.protocol("WM_DELETE_WINDOW", close_callback) | + | rootframe.protocol("WM_DELETE_WINDOW", self.close_callback) |
| − | canvas = SimplePlot( | + | canvas = SimplePlot(parent,width=320,height=320) |
canvas.bind("<Button-2>",canvas.pickWhich) | canvas.bind("<Button-2>",canvas.pickWhich) | ||
canvas.bind("<Button-3>",canvas.pickWhich) | canvas.bind("<Button-3>",canvas.pickWhich) | ||
| − | |||
| − | |||
| − | |||
canvas.pack(side=Tkinter.LEFT,fill="both",expand=1) | canvas.pack(side=Tkinter.LEFT,fill="both",expand=1) | ||
| − | canvas.axis(xint=150,xlabels=[-180 | + | canvas.axis(xint=150, |
| + | xlabels=[-180,-120,-60,0,60,120,180], | ||
| + | ylabels=[-180,-150,-120,-90,-60,-30,0,30,60,90,120,150,180]) | ||
canvas.update() | canvas.update() | ||
| − | |||
| − | |||
| − | |||
| − | + | if name is None: | |
| − | + | try: | |
| − | + | name = cmd.get_unused_name('DynoRama') | |
| − | + | except AttributeError: | |
| − | + | name = 'DynoRamaObject' | |
| + | self.rootframe = rootframe | ||
| + | self.canvas = canvas | ||
| + | self.name = name | ||
| + | self.lock = 0 | ||
| − | + | if name != 'none': | |
| − | + | auto_zoom = cmd.get('auto_zoom') | |
| − | + | cmd.set('auto_zoom', 0) | |
| + | cmd.load_callback(self, name) | ||
| + | cmd.set('auto_zoom', auto_zoom) | ||
| + | canvas.bind("<ButtonPress-1>",canvas.down) | ||
| + | canvas.bind("<ButtonRelease-1>",canvas.up) | ||
| + | canvas.bind("<Motion>",canvas.drag) | ||
| − | + | if selection is not None: | |
| + | self.start(selection) | ||
| − | + | if with_mainloop and pmgapp is None: | |
| − | + | rootframe.mainloop() | |
| − | |||
| − | |||
| − | |||
| − | |||
| − | |||
| − | |||
| − | + | def close_callback(self): | |
| − | + | cmd.delete(self.name) | |
| + | self.rootframe.destroy() | ||
| − | + | def start(self,sel): | |
| − | + | self.lock = 1 | |
| − | + | cmd.iterate('(%s) and name CA' % sel, 'idx2resn[model,index] = resn', | |
| − | + | space={'idx2resn': self.canvas.idx2resn}) | |
| − | + | for model_index, (phi,psi) in cmd.get_phipsi(sel).iteritems(): | |
| − | + | print " Plotting Phi,Psi: %8.2f,%8.2f" % (phi, psi) | |
| + | self.canvas.plot(phi, psi, model_index) | ||
| + | self.lock = 0 | ||
| − | + | def __call__(self): | |
| − | + | if self.lock: | |
| − | + | return | |
| − | + | # Loop through each item on plot to see if updated | |
| + | for value in self.canvas.shapes.itervalues(): | ||
| + | # Look for update flag... | ||
| + | if value[2]: | ||
| + | # Set residue's phi,psi to new values | ||
| + | model, index = value[5] | ||
| + | print " Re-setting Phi,Psi: %8.2f,%8.2f" % (value[3],value[4]) | ||
| + | set_phipsi(model, index, value[3], value[4]) | ||
| + | value[2] = 0 | ||
| − | + | def rama(sel='(all)', name=None): | |
| − | + | ''' | |
| − | + | DESCRIPTION | |
| − | |||
| − | + | Ramachandran Plot | |
| − | + | http://pymolwiki.org/index.php/DynoPlot | |
| − | |||
| − | |||
| − | |||
| − | |||
| − | |||
| − | |||
| − | |||
| − | |||
| − | |||
| − | |||
| − | |||
| − | + | ARGUMENTS | |
| − | |||
| − | |||
| − | + | sel = string: atom selection {default: all} | |
| − | |||
| − | |||
| − | |||
| + | name = string: name of callback object which is responsible for setting | ||
| + | angles when canvas points are dragged, or 'none' to not create a callback | ||
| + | object {default: DynoRamaObject} | ||
| + | ''' | ||
| + | DynoRamaObject(sel, name) | ||
| − | + | # Extend these commands | |
| + | cmd.extend('ramachandran', rama) | ||
| + | cmd.auto_arg[0]['ramachandran'] = cmd.auto_arg[0]['zoom'] | ||
| − | + | # Add to plugin menu | |
| − | + | def __init_plugin__(self): | |
| − | + | self.menuBar.addcascademenu('Plugin', 'PlotTools', 'Plot Tools', label='Plot Tools') | |
| + | self.menuBar.addmenuitem('PlotTools', 'command', 'Launch Rama Plot', label='Rama Plot', | ||
| + | command = lambda: DynoRamaObject('(enabled)')) | ||
| − | + | # vi:expandtab:smarttab | |
| − | |||
| − | |||
| − | |||
| − | |||
| − | |||
| − | |||
| − | |||
| − | |||
| − | |||
| − | |||
| − | |||
| − | |||
| − | |||
| − | |||
| − | |||
| − | |||
| − | |||
| − | |||
| − | |||
| − | |||
| − | |||
| − | |||
</source> | </source> | ||
Revision as of 17:43, 20 September 2011
DESCRIPTION
This script was setup to do generic plotting, that is given a set of data and axis labels it would create a plot. Initially, I had it setup to draw the plot directly in the PyMol window (allowing for both 2D and 3D style plots), but because I couldn't figure out how to billboard CGO objects (Warren told me at the time that it couldn't be done) I took a different approach. The plot now exists in it's own window and can only do 2D plots. It is however interactive. I only have here a Rama.(phi,psi) plot, but the code can be easily extended to other types of data. For instance, I had this working for an energy vs distance data that I had generated by another script.
This script will create a Phi vs Psi(Ramachandran) plot of the selection given. The plot will display data points which can be dragged around Phi,Psi space with the corresponding residue's Phi,Psi angles changing in the structure (PyMol window).
IMAGES
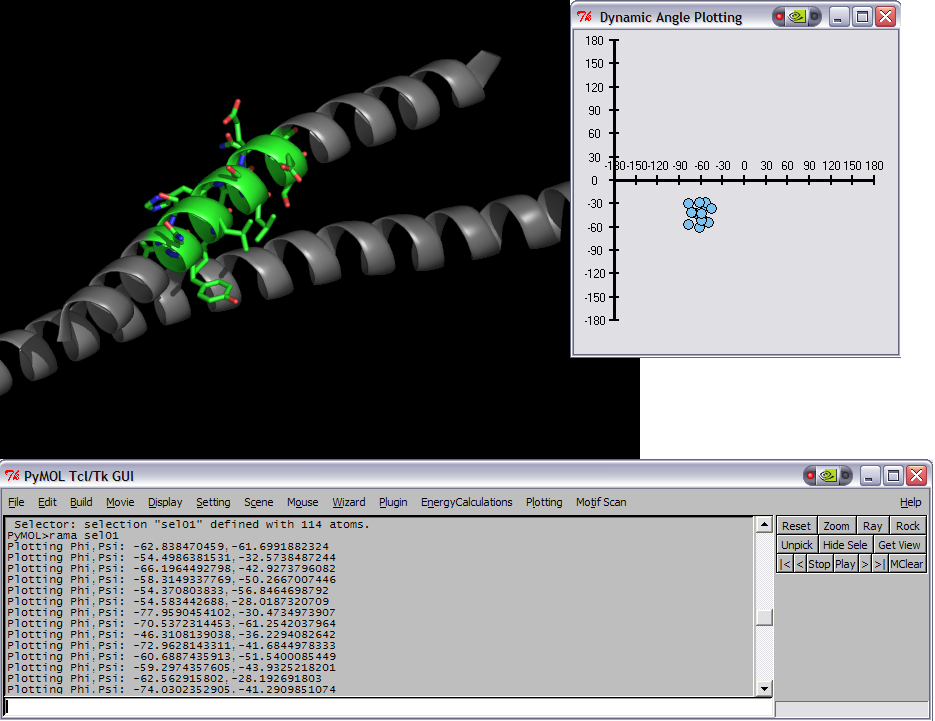
Initial Ramachandran plot of 1ENV
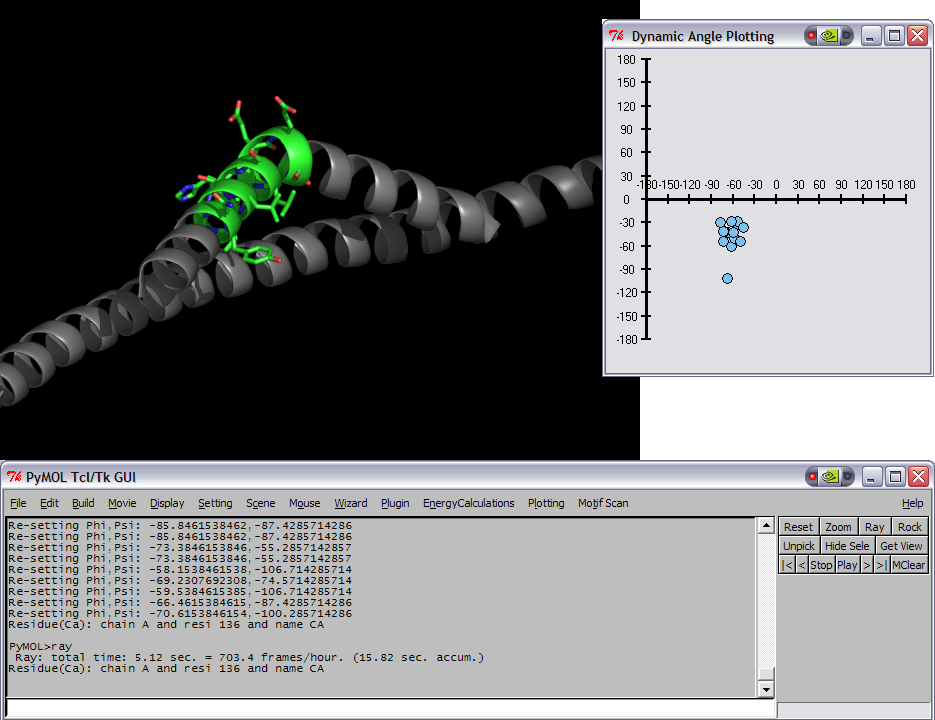
Modified pose and plot of 1ENV


SETUP
place the DynoPlot.py script into the appropriate startup directory then restart PyMol
LINUX old-style installation
$PYMOL_PATH/modules/pmg_tk/startup/
LINUX distutils installation
/usr/lib/pythonX.X/site-packages/pmg_tk/startup/
Windows
PYMOL_PATH/modules/pmg_tk/startup/ , where PYMOL_PATH on Windows is defaulted to C:/Program Files/DeLano Scientific/PyMol/start/
NOTES / STATUS
- Tested on Windows, PyMol version 0.97
- This is an initial version, which needs some work.
- Left, Right mouse buttons do different things; Right = identify data point, Left = drag data point around
- Post comments/questions or send them to: dwkulp@mail.med.upenn.edu
USAGE
rama SELECTION
EXAMPLES
- load pdb file 1ENV (download it or use the PDB loader plugin)
- select resi 129-136
- rama sel01
- rock # the object needs to be moving in order for the angles to be updated.
REFERENCES
SCRIPTS (DynoPlot.py)
DynoPlot.py
###############################################
#  File:          DynoPlot.py
#  Author:        Dan Kulp
#  Creation Date: 8/29/05
#
#  Modified 2011-09-20 by Thomas Holder
#
#  Notes:
#  Draw plots that display interactive data.
#   Phi,Psi plot shown.
###############################################


from __future__ import division
from __future__ import generators

import Tkinter
from pymol import cmd

# workaround: Set to True if nothing gets drawn on canvas, for example on linux with "pymol -x"
with_mainloop = False

class SimplePlot(Tkinter.Canvas):

    # Class variables
    mark = 'Oval' # Only 'Oval' for now..
    mark_size = 4

    def __init__(self, *args, **kwargs):
        Tkinter.Canvas.__init__(self, *args, **kwargs)
        self.xlabels = []   # axis labels
        self.ylabels = []
        self.spacingx = 0   # spacing in x direction
        self.spacingy = 0
        self.xmin = 0       # min value from each axis
        self.ymin = 0
        self.lastx = 0      # previous x,y pos of mouse
        self.lasty = 0
        self.isdown  = 0    # flag for mouse pressed
        self.item = (0,)    # items array used for clickable events
        self.shapes = {}    # store plot data, x,y etc..
        self.idx2resn = {}  # residue name mapping

    def axis(self,xmin=40,xmax=300,ymin=10,ymax=290,xint=290,yint=40,xlabels=[],ylabels=[]):

        # Store variables in self object
        self.xlabels = xlabels
        self.ylabels = ylabels
        self.spacingx = (xmax-xmin) / (len(xlabels) - 1)
        self.spacingy = (ymax-ymin) / (len(ylabels) - 1)
        self.xmin = xmin
        self.ymin = ymin

        # Create axis lines
        self.create_line((xmin,xint,xmax,xint),fill="black",width=3)
        self.create_line((yint,ymin,yint,ymax),fill="black",width=3)

        # Create tick marks and labels
        nextspot = xmin
        for label in xlabels:
            self.create_line((nextspot, xint+5,nextspot, xint-5),fill="black",width=2)
            self.create_text(nextspot, xint-15, text=label)
            if len(xlabels) == 1:
                nextspot = xmax
            else:
                nextspot += (xmax - xmin)/ (len(xlabels) - 1)


        nextspot = ymax
        for label in ylabels:
            self.create_line((yint+5,nextspot,yint-5,nextspot),fill="black",width=2)
            self.create_text(yint-20,nextspot,text=label)
            if len(ylabels) == 1:
                nextspot = ymin
            else:
                nextspot -= (ymax - ymin)/ (len(ylabels) - 1)


    # Plot a point
    def plot(self,xp,yp,meta):

        # Convert from 'label' space to 'pixel' space
        x = self.convertToPixel("X",xp)
        y = self.convertToPixel("Y",yp)

        resn = self.idx2resn.get(meta)
        mark = {'GLY': 'Tri', 'PRO': 'Rect'}.get(resn, self.mark)

        if mark == 'Oval':
            create_shape = self.create_oval
            coords = [x-self.mark_size, y-self.mark_size,
                    x+self.mark_size, y+self.mark_size]
        elif mark == 'Tri':
            create_shape = self.create_polygon
            coords = [x, y-self.mark_size,
                    x+self.mark_size, y+self.mark_size,
                    x-self.mark_size, y+self.mark_size]
        else:
            create_shape = self.create_rectangle
            coords = [x-self.mark_size, y-self.mark_size,
                    x+self.mark_size, y+self.mark_size]

        oval = create_shape(*coords,
                width=1, outline="black", fill="SkyBlue2")
        self.shapes[oval] = [x,y,0,xp,yp,meta]

    # Convert from pixel space to label space
    def convertToLabel(self,axis, value):

        # Defaultly use X-axis info
        label0  = self.xlabels[0]
        label1  = self.xlabels[1]
        spacing = self.spacingx
        min     = self.xmin

        # Set info for Y-axis use
        if axis == "Y":
            label0    = self.ylabels[0]
            label1    = self.ylabels[1]
            spacing   = self.spacingy
            min       = self.ymin

        pixel = value - min
        label = pixel / spacing
        label = label0 + label * abs(label1 - label0)

        if axis == "Y":
                label = - label

        return label

    # Converts value from 'label' space to 'pixel' space
    def convertToPixel(self,axis, value):

        # Defaultly use X-axis info
        label0  = self.xlabels[0]
        label1  = self.xlabels[1]
        spacing = self.spacingx
        min     = self.xmin

        # Set info for Y-axis use
        if axis == "Y":
            label0    = self.ylabels[0]
            label1    = self.ylabels[1]
            spacing   = self.spacingy
            min       = self.ymin

        # Get axis increment in 'label' space
        inc = abs(label1 - label0)

        # 'Label' difference from value and smallest label (label0)
        diff = float(value - label0)

        # Get whole number in 'label' space
        whole = int(diff / inc)

        # Get fraction number in 'label' space
        part = float(float(diff/inc) - whole)

        # Return 'pixel' position value
        pixel = whole * spacing + part * spacing

        # Reverse number by subtracting total number of pixels - value pixels
        if axis == "Y":
           tot_label_diff = float(self.ylabels[-1] - label0)
           tot_label_whole = int(tot_label_diff / inc)
           tot_label_part = float(float(tot_label_diff / inc) - tot_label_whole)
           tot_label_pix  = tot_label_whole * spacing + tot_label_part *spacing

           pixel = tot_label_pix - pixel

        # Add min edge pixels
        pixel = pixel + min

        return pixel


    # Print out which data point you just clicked on..
    def pickWhich(self,event):

        # Find closest data point
        x = event.widget.canvasx(event.x)
        y = event.widget.canvasx(event.y)
        spot = event.widget.find_closest(x,y)

        # Print the shape's meta information corresponding with the shape that was picked
        if spot[0] in self.shapes:
            cmd.select('sele', '(%s`%d)' % self.shapes[spot[0]][5])
            cmd.iterate('sele', 'print " You clicked /%s/%s/%s/%s`%s/%s (DynoPlot)" %' + \
                    ' (model, segi, chain, resn, resi, name)')
            cmd.center('byres sele', animate=1)

    # Mouse Down Event
    def down(self,event):

        # Store x,y position
        self.lastx = event.x
        self.lasty = event.y

        # Find the currently selected item
        x = event.widget.canvasx(event.x)
        y = event.widget.canvasx(event.y)
        self.item = event.widget.find_closest(x,y)

        # Identify that the mouse is down
        self.isdown  = 1

    # Mouse Up Event
    def up(self,event):

        # Get label space version of x,y
        labelx = self.convertToLabel("X",event.x)
        labely = self.convertToLabel("Y",event.y)

        # Convert new position into label space..
        if self.item[0] in self.shapes:
            self.shapes[self.item[0]][0] = event.x
            self.shapes[self.item[0]][1] = event.y
            self.shapes[self.item[0]][2] =  1
            self.shapes[self.item[0]][3] = labelx
            self.shapes[self.item[0]][4] = labely

        # Reset Flags
        self.item = (0,)
        self.isdown = 0

    # Mouse Drag(Move) Event
    def drag(self,event):

        # Check that mouse is down and item clicked is a valid data point
        if self.isdown and self.item[0] in self.shapes:

            self.move(self.item, event.x - self.lastx, event.y - self.lasty)

            self.lastx = event.x
            self.lasty = event.y

def set_phipsi(model, index, phi, psi):
    atsele = [
        'first ((%s`%d) extend 2 and name C)' % (model, index), # prev C
        'first ((%s`%d) extend 1 and name N)' % (model, index), # this N
        '(%s`%d)' % (model, index),                             # this CA
        'last ((%s`%d) extend 1 and name C)' % (model, index),  # this C
        'last ((%s`%d) extend 2 and name N)' % (model, index),  # next N
    ]
    try:
        cmd.set_dihedral(atsele[0], atsele[1], atsele[2], atsele[3], phi)
        cmd.set_dihedral(atsele[1], atsele[2], atsele[3], atsele[4], psi)
    except:
        print ' DynoPlot Error: cmd.set_dihedral failed'

# New Callback object, so that we can update the structure when phi,psi points are moved.
class DynoRamaObject:
    def __init__(self, selection=None, name=None):
        from pymol import _ext_gui as pmgapp
        if pmgapp is not None:
            import Pmw
            rootframe = Pmw.MegaToplevel(pmgapp.root)
            parent = rootframe.interior()
        else:
            rootframe = Tkinter.Tk()
            parent = rootframe

        rootframe.title(' Dynamic Angle Plotting ')
        rootframe.protocol("WM_DELETE_WINDOW", self.close_callback)

        canvas = SimplePlot(parent,width=320,height=320)
        canvas.bind("<Button-2>",canvas.pickWhich)
        canvas.bind("<Button-3>",canvas.pickWhich)
        canvas.pack(side=Tkinter.LEFT,fill="both",expand=1)
        canvas.axis(xint=150,
                xlabels=[-180,-120,-60,0,60,120,180],
                ylabels=[-180,-150,-120,-90,-60,-30,0,30,60,90,120,150,180])
        canvas.update()

        if name is None:
            try:
                name = cmd.get_unused_name('DynoRama')
            except AttributeError:
                name = 'DynoRamaObject'

        self.rootframe = rootframe
        self.canvas = canvas
        self.name = name
        self.lock = 0

        if name != 'none':
            auto_zoom = cmd.get('auto_zoom')
            cmd.set('auto_zoom', 0)
            cmd.load_callback(self, name)
            cmd.set('auto_zoom', auto_zoom)
            canvas.bind("<ButtonPress-1>",canvas.down)
            canvas.bind("<ButtonRelease-1>",canvas.up)
            canvas.bind("<Motion>",canvas.drag)

        if selection is not None:
            self.start(selection)

        if with_mainloop and pmgapp is None:
            rootframe.mainloop()

    def close_callback(self):
        cmd.delete(self.name)
        self.rootframe.destroy()

    def start(self,sel):
        self.lock = 1
        cmd.iterate('(%s) and name CA' % sel, 'idx2resn[model,index] = resn',
                space={'idx2resn': self.canvas.idx2resn})
        for model_index, (phi,psi) in cmd.get_phipsi(sel).iteritems():
            print " Plotting Phi,Psi: %8.2f,%8.2f" % (phi, psi)
            self.canvas.plot(phi, psi, model_index)
        self.lock = 0

    def __call__(self):
        if self.lock:
            return
        # Loop through each item on plot to see if updated
        for value in self.canvas.shapes.itervalues():
            # Look for update flag...
            if value[2]:
                # Set residue's phi,psi to new values
                model, index = value[5]
                print " Re-setting Phi,Psi: %8.2f,%8.2f" % (value[3],value[4])
                set_phipsi(model, index, value[3], value[4])
                value[2] = 0

def rama(sel='(all)', name=None):
    '''
DESCRIPTION

    Ramachandran Plot
    http://pymolwiki.org/index.php/DynoPlot

ARGUMENTS

    sel = string: atom selection {default: all}

    name = string: name of callback object which is responsible for setting
    angles when canvas points are dragged, or 'none' to not create a callback
    object {default: DynoRamaObject}
    '''
    DynoRamaObject(sel, name)

# Extend these commands
cmd.extend('ramachandran', rama)
cmd.auto_arg[0]['ramachandran'] = cmd.auto_arg[0]['zoom']

# Add to plugin menu
def __init_plugin__(self):
    self.menuBar.addcascademenu('Plugin', 'PlotTools', 'Plot Tools', label='Plot Tools')
    self.menuBar.addmenuitem('PlotTools', 'command', 'Launch Rama Plot', label='Rama Plot',
            command = lambda: DynoRamaObject('(enabled)'))

# vi:expandtab:smarttab