This is a read-only mirror of pymolwiki.org
Difference between revisions of "Lines"
Jump to navigation
Jump to search
| Line 36: | Line 36: | ||
==See Also== | ==See Also== | ||
| − | Please read about other representations in the '''Representation Category'''. | + | Please read about other representations in the '''Representation Category'''. <br> |
| − | [[Measure_Distance]] | + | [[Measure_Distance]] <br> |
| − | [[Distance]] | + | [[Distance]] <br> |
Revision as of 20:16, 17 April 2009
Overview
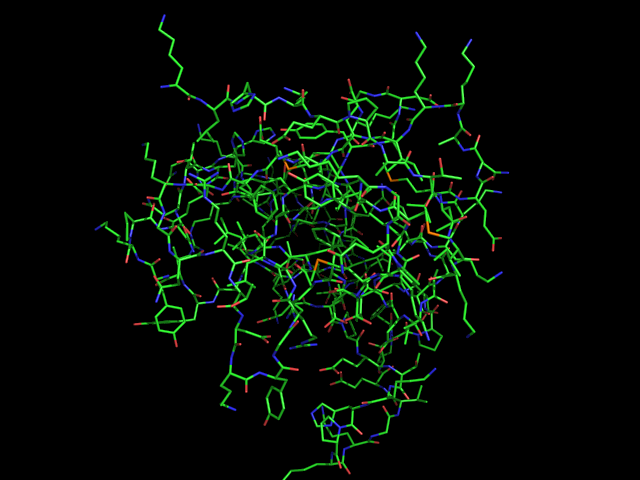
Lines is name of the basic representation for atoms and bonds in PyMOL. Lines is a very simple representation, where each atom bond is displayed as a single colored line, and each atom is displayed as the intersection of any two or more non-terminal bonds.
Usage
# show everything as lines
show lines

# only show residues 50-80 as lines
show lines, i.50-80
Examples
Example: Displaying dashed lines between two atoms
The following commands will create a dashed line between two atoms.
# first, create two named selections
select a, ///A/501/02
select b, ///B/229/N
# calculate & show the distance from selection a to selection b.
distance d, a, b
# hide just the distance labels; the
# dashed bars should still be shown
hide labels, d
Technically, the object d is a labelled distance, only the label is hidden. When ray-tracing the image, the dashes come out a bit fat. You can slim them with
set dash_gap, 0.5
set dash_radius, 0.1
before the 'ray' command.
See Also
Please read about other representations in the Representation Category.
Measure_Distance
Distance
