This is a read-only mirror of pymolwiki.org
Difference between revisions of "Displacementmap"
m (7 revisions) |
|||
| (46 intermediate revisions by one other user not shown) | |||
| Line 1: | Line 1: | ||
| + | {{Infobox script-repo | ||
| + | |type = script | ||
| + | |filename = displacementmap.py | ||
| + | |author = [[User:Tlinnet|Troels E. Linnet]] | ||
| + | |license = BSD | ||
| + | }} | ||
| + | |||
== Overview == | == Overview == | ||
DisplacementMap is made for easy investigations of suitable positions for site-directed mutagenesis of amino residues into cysteines and FRET/EPR pair labelling. | DisplacementMap is made for easy investigations of suitable positions for site-directed mutagenesis of amino residues into cysteines and FRET/EPR pair labelling. | ||
| − | A Open and Closed form of a protein should be loaded. New objects should be created for the selected asymmetric unit. | + | |
| − | Parts of the protein should be aligned, leaving the flexible part in two different positions. | + | A Open and Closed form of a protein should be loaded. New objects should be created for the selected asymmetric unit. Parts of the protein should be aligned, leaving the flexible part in two different positions. |
| − | The input is | + | |
| − | + | The input is the objects, Open (molecule1) and Closed (molecule2). <br /> | |
| + | Further is the criteria for selecting which atom the distance should be calculated between. Standard is atom='CA' (atom). <br /> | ||
| + | Then one selects the Förster distance R0 (mindist). This is the minimum distance between the residues. This depends of the selection of the FRET pair and protein at hand. But usually in the range 40 - 80 Angstrom is suitable. <br /> | ||
| + | Then one defines the minimum displacement that is accepted. Usually R0/2 (mindelta). <br /> | ||
| + | The script will find the 5 best (listlength=5) positive and negative distance displacement between the two objects. | ||
| + | |||
| + | It parses the results back to Pymol, that is standard set to show it as sticks (showsticks='yes'). <br /> | ||
| + | If one is looking for a particular residue range for the FRET pair, this can be specified with two input. | ||
| + | resi1=24.45-47.86 resi2=100-105.107 resi1 is "from" and resi2 is "to". Individual residues are split by a ".", and ranges are defined with "-".<br /> | ||
In the end, it makes a large data-matrix with all the distances. It also produces a gnuplot file, for easy visualisation. Just drag the .plt file for win gnuplot command window and it plots your datamatrix. | In the end, it makes a large data-matrix with all the distances. It also produces a gnuplot file, for easy visualisation. Just drag the .plt file for win gnuplot command window and it plots your datamatrix. | ||
== Bugs == | == Bugs == | ||
If the criterion is set to low, the memory gets flooded in the data-matrix file, making the file unreadable. No solutions found yet. | If the criterion is set to low, the memory gets flooded in the data-matrix file, making the file unreadable. No solutions found yet. | ||
| − | |||
| − | |||
| − | |||
| − | |||
| − | |||
| − | |||
| − | |||
| − | |||
== Example == | == Example == | ||
| − | < | + | <syntaxhighlight lang="python"> |
| − | + | dispmap(molecule1="NIL", molecule2="NIL", mindist=30.0, mindelta=15.0, resi1=str(0), resi2=str(0), atom='CA', listlength=5, showsticks='yes'): | |
| − | + | </syntaxhighlight> | |
| − | </ | + | Use of functions |
| + | <syntaxhighlight lang="python"> | ||
| + | import displacementmap | ||
| + | dispmap Open5NT, Closed5NT, 40.0, 15.0, resi1=206, resi2=1-512.515-550 | ||
| + | dispmap Open5NT, Closed5NT, 30.0, 15.0, resi2=1-512.515-550, atom=CA, listlength=10 | ||
| + | </syntaxhighlight> | ||
== Output == | == Output == | ||
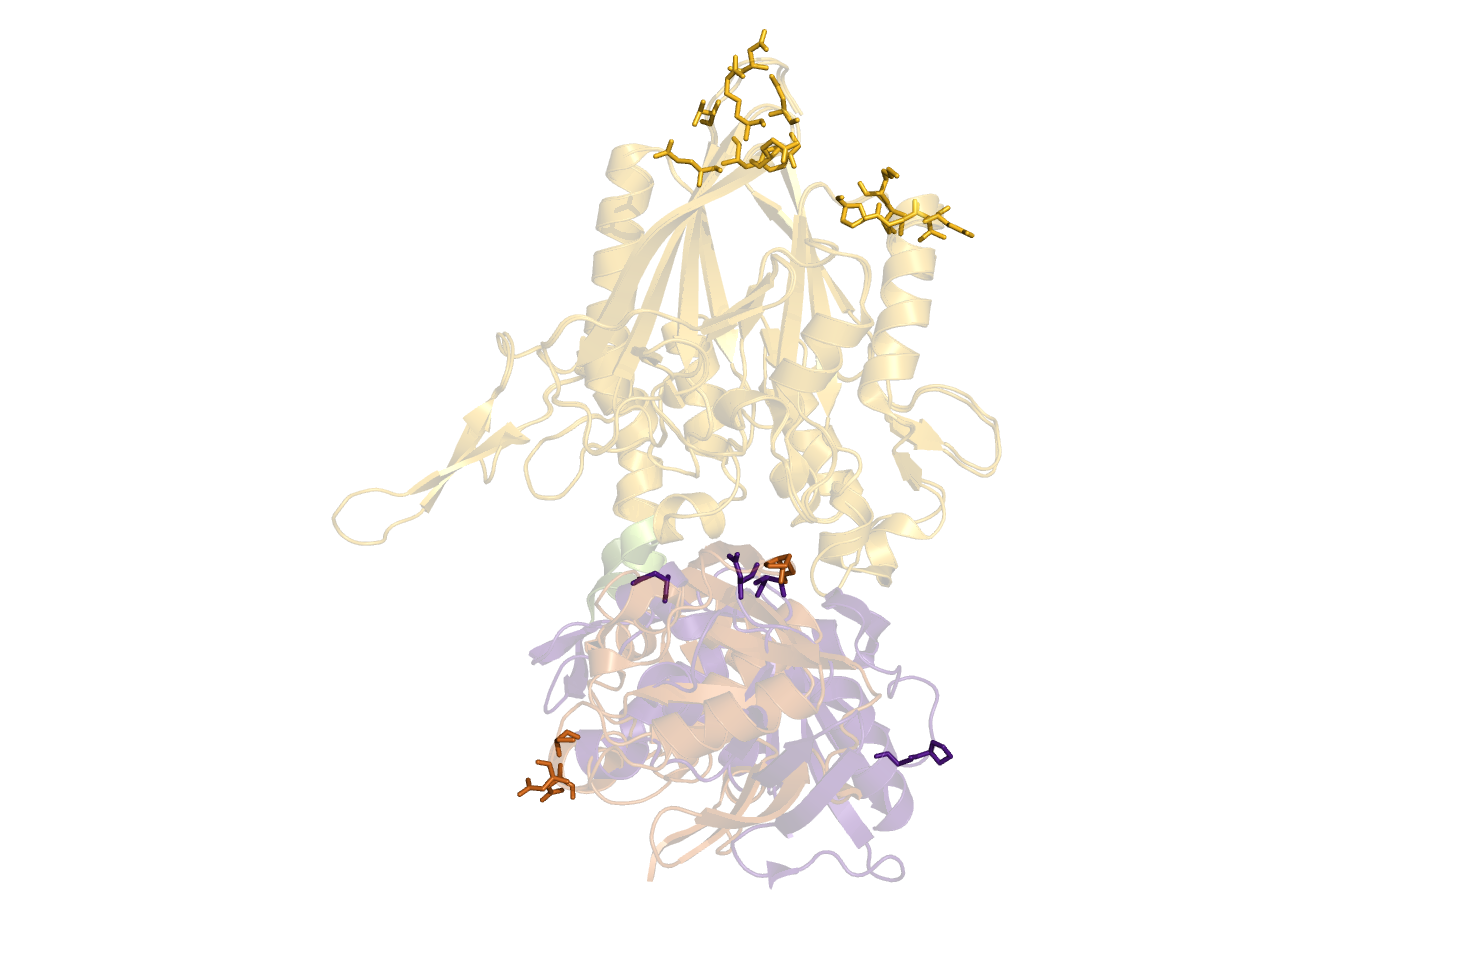
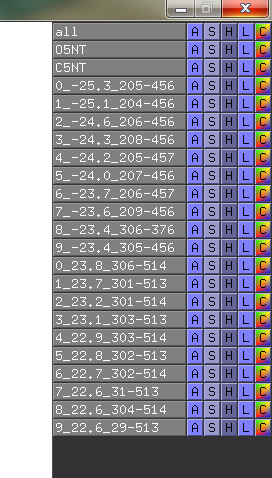
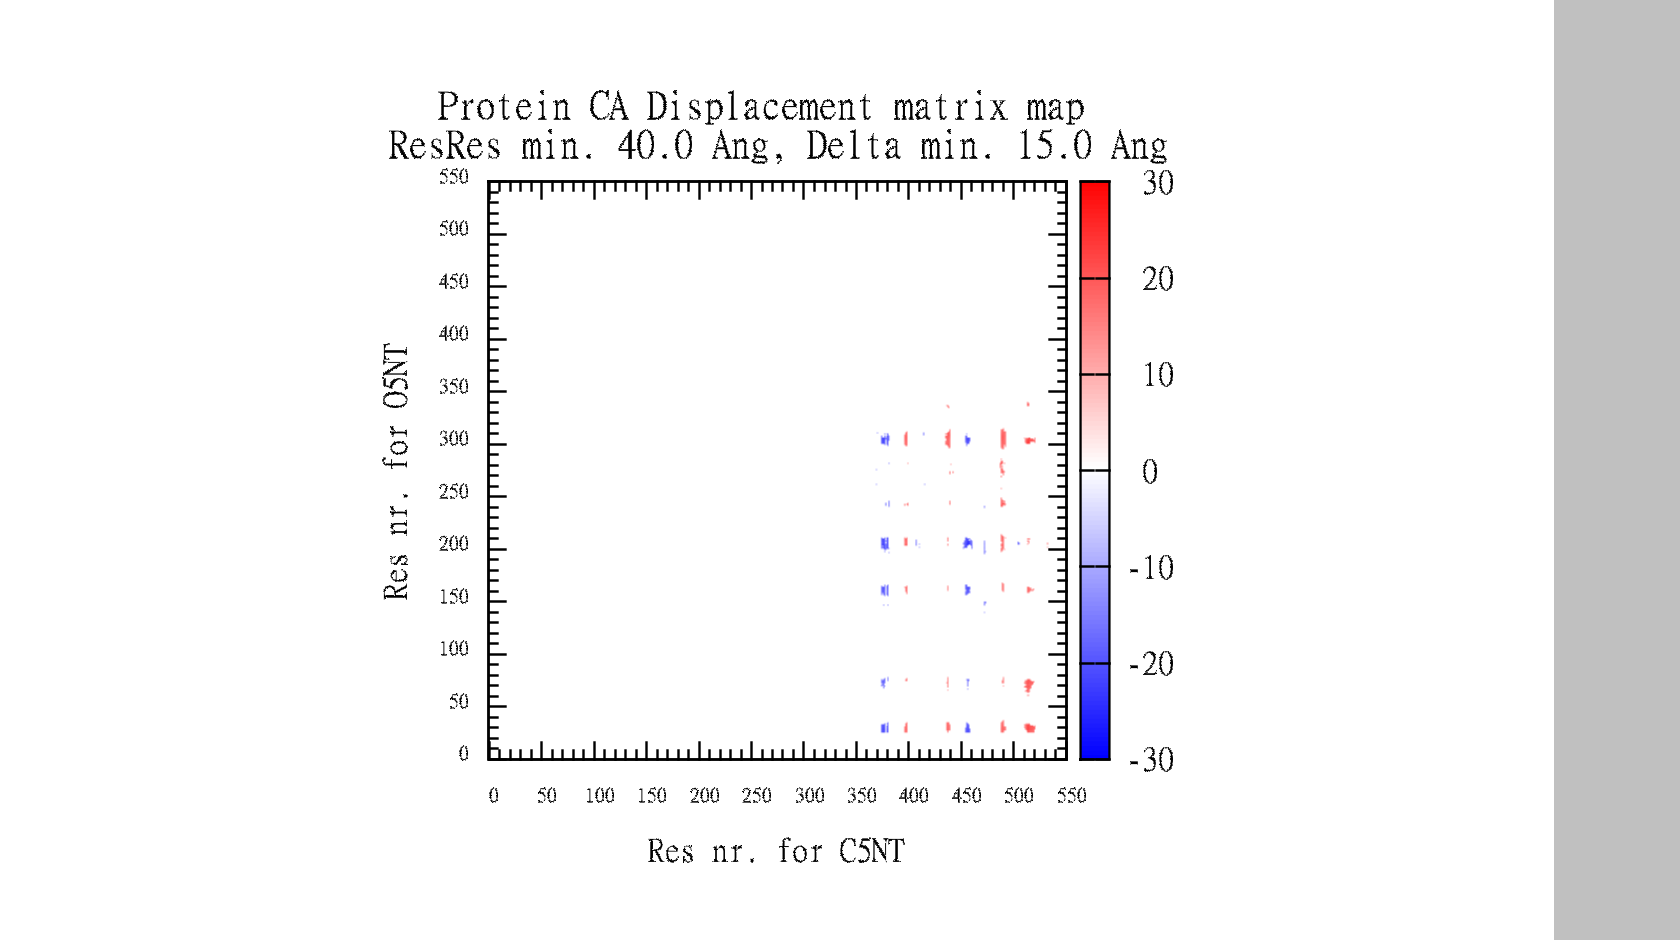
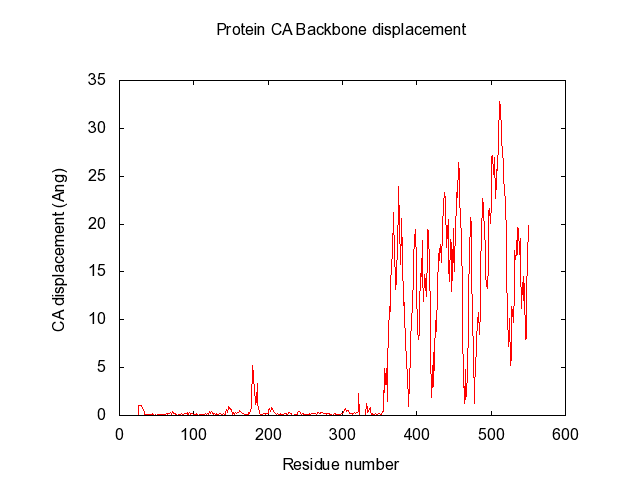
| − | Suggestions are created in pymol, and gnuplot file is created for easy visualisation of data-matrix. | + | Suggestions are created in pymol, and gnuplot file is created for easy visualisation of pair data-matrix and the general backbone displacement. |
| − | <gallery heights=" | + | <gallery heights="200px" widths="200px"> |
| − | Image:O5NT- | + | Image:O5NT-C5NT-CA-dist.png| |
| − | Image:O5NT- | + | Image:O5NT-C5NT-CA-dist-menu.png| |
| + | Image:O5NT-C5NT-CA-dist-gnuplot.png| | ||
| + | Image:O5NT-C5NT-CA-dist-backbone.png | ||
</gallery> | </gallery> | ||
| − | |||
== Text output == | == Text output == | ||
In the data-matrix.txt file, you find the best suggestions | In the data-matrix.txt file, you find the best suggestions | ||
| − | < | + | <syntaxhighlight lang="text"> |
| − | # Input 1: | + | # Input 1: Open5NT and Input 2: Closed5NT |
| − | # Find for: CA with min. residue-residue dist: | + | # Find for: CA with min. residue-residue dist: 30.0 Angstrom |
# Looking for min. displacement dist: 15.0 Angstrom | # Looking for min. displacement dist: 15.0 Angstrom | ||
# I give nr# suggestions: 5, and do I show sticks in pymol?: yes | # I give nr# suggestions: 5, and do I show sticks in pymol?: yes | ||
# I look for suggestions in the range: ([0]=>means all residues) | # I look for suggestions in the range: ([0]=>means all residues) | ||
| − | # for Input 1: [' | + | # for Input 1: ['0'] and for Input 2: ['0'] |
| − | ########################################################################### | + | # Mutation info is BLOSUM62 log-odds likelihood score and PAM250 is probability in % for evolutionary distance |
| − | + | ########################################################################################################### | |
| − | ########################################################################### | + | # Max Negative and positive distances # Mutation info # |
| − | # | + | ########################################################################################################### |
| − | # | + | # Obj.1 Obj.2 Delta Op-Op Cl-Cl # Obj.1 Obj.2 Delta Op-Op Cl-Cl # Res.1 Res.2 # Res.1 Res.2 # |
| − | ########################################################################### | + | # Res.1 Res.2 -Dist Dist Dist # Res.1 Res.2 +Dist Dist Dist # B62/PAM250% # B62/PAM250% # |
| − | # | + | ########################################################################################################### |
| − | # | + | # PRO241 ASP456 -25.7 59.1 33.4 # PRO274 PRO513 26.8 31.2 58.0 # -3/ 2 -3/ 1 # -3/ 2 -3/ 2 # |
| − | # | + | # LYS197 ASP456 -25.6 57.3 31.7 # THR273 PRO513 26.1 31.6 57.7 # -1/ 1 -3/ 1 # -1/ 2 -3/ 2 # |
| − | # | + | # PRO513 ASP456 -25.4 32.4 7.0 # PRO274 GLY514 24.8 32.9 57.6 # -3/ 2 -3/ 1 # -3/ 2 -3/ 2 # |
| − | # | + | # LEU198 ASP456 -25.3 59.0 33.7 # PRO274 LYS512 24.7 30.3 55.0 # -1/ 1 -3/ 1 # -3/ 2 -1/ 1 # |
| − | + | # GLN201 ASP456 -25.2 62.8 37.6 # ASN311 PRO513 24.7 35.6 60.3 # -3/ 1 -3/ 1 # -3/ 1 -3/ 2 # | |
| − | + | </syntaxhighlight> | |
| − | + | The script also automatically make the gnuplot plot file (.plt), with all the defined variables, for easy visualisation of the data-matrix.txt and the backbone displacement. | |
| − | |||
| − | |||
| − | |||
| − | # | ||
| − | # | ||
| − | |||
| − | # | ||
| − | # | ||
| − | |||
| − | # | ||
| − | # | ||
| − | |||
| − | |||
| − | # | ||
| − | |||
| − | |||
| − | |||
| − | |||
| − | |||
| − | |||
| − | |||
| − | |||
| − | |||
| − | |||
| − | |||
| − | |||
| − | |||
| − | |||
| − | |||
| − | |||
| − | |||
| − | |||
| − | |||
| − | |||
| − | |||
| − | |||
| − | |||
| − | |||
| − | # | ||
| − | |||
| − | |||
| − | |||
| − | |||
| − | |||
| − | |||
| − | |||
| − | |||
| − | |||
| − | |||
| − | |||
| − | |||
| − | |||
| − | |||
| − | |||
| − | |||
| − | |||
| − | |||
| − | |||
| − | |||
| − | |||
| − | |||
| − | |||
| − | |||
| − | |||
| − | |||
| − | |||
| − | |||
| − | |||
| − | |||
| − | |||
| − | |||
| − | |||
| − | |||
| − | |||
| − | |||
| − | |||
| − | |||
| − | |||
| − | |||
| − | |||
| − | |||
| − | |||
| − | |||
| − | |||
| − | |||
| − | |||
| − | |||
| − | |||
| − | |||
| − | |||
| − | |||
| − | |||
| − | |||
| − | |||
| − | |||
| − | |||
| − | |||
| − | |||
| − | |||
| − | |||
| − | |||
| − | |||
| − | |||
| − | |||
| − | |||
| − | |||
| − | |||
| − | |||
| − | |||
| − | |||
| − | |||
| − | |||
| − | |||
| − | |||
| − | |||
| − | |||
| − | |||
| − | |||
| − | |||
| − | |||
| − | |||
| − | |||
| − | |||
| − | |||
| − | |||
| − | |||
| − | |||
| − | |||
| − | |||
| − | |||
| − | |||
| − | |||
| − | |||
| − | |||
| − | |||
| − | |||
| − | |||
| − | |||
| − | |||
| − | |||
| − | |||
| − | |||
| − | |||
| − | |||
| − | |||
| − | |||
| − | |||
| − | |||
| − | |||
| − | |||
| − | |||
| − | |||
| − | |||
| − | |||
| − | |||
| − | |||
| − | |||
| − | |||
| − | |||
| − | |||
| − | |||
| − | |||
| − | |||
| − | |||
| − | |||
| − | |||
| − | |||
| − | |||
| − | |||
| − | |||
| − | |||
| − | |||
| − | |||
| − | |||
| − | |||
| − | |||
| − | |||
| − | |||
| − | |||
| − | |||
| − | |||
| − | |||
| − | |||
| − | |||
| − | |||
| − | |||
| − | |||
| − | |||
| − | |||
| − | |||
| − | |||
| − | |||
| − | |||
| − | |||
| − | |||
| − | |||
| − | |||
| − | |||
| − | |||
| − | |||
| − | |||
| − | |||
| − | |||
| − | |||
| − | |||
| − | |||
| − | |||
| − | |||
| − | |||
| − | |||
| − | |||
| − | |||
| − | |||
| − | |||
| − | |||
| − | |||
| − | |||
| − | |||
| − | |||
| − | |||
| − | |||
| − | |||
| − | |||
| − | |||
| − | |||
| − | |||
| − | |||
| − | |||
| − | |||
| − | |||
| − | |||
| − | |||
| − | |||
| − | |||
| − | |||
| − | |||
| − | |||
| − | |||
| − | |||
| − | |||
| − | |||
| − | |||
| − | |||
| − | |||
| − | |||
| − | |||
| − | |||
| − | |||
| − | |||
| − | |||
| − | |||
| − | |||
| − | |||
| − | |||
| − | |||
| − | |||
| − | |||
| − | |||
| − | |||
| − | |||
| − | |||
| − | |||
| − | |||
| − | |||
| − | |||
| − | |||
| − | |||
| − | |||
| − | |||
| − | |||
| − | |||
| − | |||
| − | |||
| − | |||
| − | |||
| − | |||
| − | |||
| − | |||
| − | |||
| − | |||
| − | |||
| − | |||
| − | |||
| − | |||
| − | |||
| − | |||
| − | |||
| − | |||
| − | |||
| − | |||
| − | |||
| − | |||
| − | |||
| − | |||
| − | |||
| − | |||
| − | |||
| − | |||
| − | |||
| − | |||
| − | |||
| − | |||
| − | |||
| − | |||
| − | |||
| − | |||
| − | |||
| − | |||
| − | |||
| − | |||
| − | |||
| − | |||
| − | |||
| − | |||
| − | |||
| − | |||
| − | |||
| − | |||
| − | |||
| − | |||
| − | |||
| − | |||
| − | |||
| − | |||
| − | |||
| − | |||
| − | |||
| − | |||
| − | |||
| − | |||
| − | |||
| − | == | + | == Example 1 == |
| − | + | {{Template:PymolScriptRepoDownload|examples/displacementmap_1.pml}} | |
| − | + | <include src="https://raw.github.com/Pymol-Scripts/Pymol-script-repo/master/examples/displacementmap_1.pml" highlight="python" /> | |
== References == | == References == | ||
| Line 406: | Line 88: | ||
''Journal of chemical physics'' VOLUME 117, Number 24 22 '''December 2002''' | ''Journal of chemical physics'' VOLUME 117, Number 24 22 '''December 2002''' | ||
| − | For inspiration to DisplacementMap. Fig: 6, Difference-distance matrix for the difference in CA-CA distances. <br> | + | '''For inspiration to DisplacementMap. Fig: 6, Difference-distance matrix for the difference in CA-CA distances.''' <br> |
''Structure of a Hinge-bending Bacteriophage T4 Lysozyme Mutant, Ile3 -> Pro'' <br> | ''Structure of a Hinge-bending Bacteriophage T4 Lysozyme Mutant, Ile3 -> Pro'' <br> | ||
M. M. Dixon, H. Nicholsont, L. Shewchuk W. A. Baase and B. W. Matthews1 <br> | M. M. Dixon, H. Nicholsont, L. Shewchuk W. A. Baase and B. W. Matthews1 <br> | ||
| Line 413: | Line 95: | ||
[[Category:Script_Library|DisplacementMap]] | [[Category:Script_Library|DisplacementMap]] | ||
[[Category:Structural_Biology_Scripts]] | [[Category:Structural_Biology_Scripts]] | ||
| + | [[Category:Pymol-script-repo]] | ||
Latest revision as of 02:17, 28 March 2014
| Type | Python Script |
|---|---|
| Download | displacementmap.py |
| Author(s) | Troels E. Linnet |
| License | BSD |
| This code has been put under version control in the project Pymol-script-repo | |
Overview
DisplacementMap is made for easy investigations of suitable positions for site-directed mutagenesis of amino residues into cysteines and FRET/EPR pair labelling.
A Open and Closed form of a protein should be loaded. New objects should be created for the selected asymmetric unit. Parts of the protein should be aligned, leaving the flexible part in two different positions.
The input is the objects, Open (molecule1) and Closed (molecule2).
Further is the criteria for selecting which atom the distance should be calculated between. Standard is atom='CA' (atom).
Then one selects the Förster distance R0 (mindist). This is the minimum distance between the residues. This depends of the selection of the FRET pair and protein at hand. But usually in the range 40 - 80 Angstrom is suitable.
Then one defines the minimum displacement that is accepted. Usually R0/2 (mindelta).
The script will find the 5 best (listlength=5) positive and negative distance displacement between the two objects.
It parses the results back to Pymol, that is standard set to show it as sticks (showsticks='yes').
If one is looking for a particular residue range for the FRET pair, this can be specified with two input.
resi1=24.45-47.86 resi2=100-105.107 resi1 is "from" and resi2 is "to". Individual residues are split by a ".", and ranges are defined with "-".
In the end, it makes a large data-matrix with all the distances. It also produces a gnuplot file, for easy visualisation. Just drag the .plt file for win gnuplot command window and it plots your datamatrix.
Bugs
If the criterion is set to low, the memory gets flooded in the data-matrix file, making the file unreadable. No solutions found yet.
Example
dispmap(molecule1="NIL", molecule2="NIL", mindist=30.0, mindelta=15.0, resi1=str(0), resi2=str(0), atom='CA', listlength=5, showsticks='yes'):
Use of functions
import displacementmap
dispmap Open5NT, Closed5NT, 40.0, 15.0, resi1=206, resi2=1-512.515-550
dispmap Open5NT, Closed5NT, 30.0, 15.0, resi2=1-512.515-550, atom=CA, listlength=10
Output
Suggestions are created in pymol, and gnuplot file is created for easy visualisation of pair data-matrix and the general backbone displacement.
Text output
In the data-matrix.txt file, you find the best suggestions
# Input 1: Open5NT  and Input 2: Closed5NT
# Find for: CA  with min. residue-residue dist: 30.0 Angstrom
# Looking for min. displacement dist: 15.0 Angstrom
# I give nr# suggestions: 5, and do I show sticks in pymol?: yes
# I look for suggestions in the range: ([0]=>means all residues)
# for Input 1: ['0'] and for Input 2: ['0']
# Mutation info is BLOSUM62 log-odds likelihood score and PAM250 is probability in % for evolutionary distance
###########################################################################################################
# Max Negative and positive distances                                       #       Mutation info         #
###########################################################################################################
# Obj.1   Obj.2   Delta   Op-Op Cl-Cl # Obj.1   Obj.2   Delta   Op-Op Cl-Cl # Res.1  Res.2 # Res.1  Res.2 #
# Res.1   Res.2   -Dist   Dist  Dist  # Res.1   Res.2   +Dist   Dist  Dist  # B62/PAM250%  # B62/PAM250%  #
###########################################################################################################
# PRO241  ASP456  -25.7   59.1   33.4 # PRO274  PRO513   26.8   31.2   58.0 # -3/ 2 -3/ 1  # -3/ 2 -3/ 2  #
# LYS197  ASP456  -25.6   57.3   31.7 # THR273  PRO513   26.1   31.6   57.7 # -1/ 1 -3/ 1  # -1/ 2 -3/ 2  #
# PRO513  ASP456  -25.4   32.4    7.0 # PRO274  GLY514   24.8   32.9   57.6 # -3/ 2 -3/ 1  # -3/ 2 -3/ 2  #
# LEU198  ASP456  -25.3   59.0   33.7 # PRO274  LYS512   24.7   30.3   55.0 # -1/ 1 -3/ 1  # -3/ 2 -1/ 1  #
# GLN201  ASP456  -25.2   62.8   37.6 # ASN311  PRO513   24.7   35.6   60.3 # -3/ 1 -3/ 1  # -3/ 1 -3/ 2  #
The script also automatically make the gnuplot plot file (.plt), with all the defined variables, for easy visualisation of the data-matrix.txt and the backbone displacement.
Example 1
| Download: examples/displacementmap_1.pml | |
| This code has been put under version control in the project Pymol-script-repo | |
<include src="https://raw.github.com/Pymol-Scripts/Pymol-script-repo/master/examples/displacementmap_1.pml" highlight="python" />
References
For EPR considerations
Conformation of T4 Lysozyme in Solution. Hinge-Bending Motion and the Substrate-Induced Conformational Transition Studied by Site-Directed Spin Labeling
Hassane S. Mchaourab, Kyoung Joon Oh, Celia J. Fang, and Wayne L. Hubbell
Biochemistry 1997, 36, 307-316
Probing Single-Molecule T4 Lysozyme Conformational Dynamics by Intramolecular Fluorescence Energy Transfer
Yu Chen, Dehong Hu, Erich R. Vorpagel, and H. Peter Lu
J. Phys. Chem. B 2003, 107, 7947-7956
For FRET pair selection and considerations
Fluorescent probes and bioconjugation chemistries for single-molecule fluorescence analysis of biomolecules
Achillefs N. Kapanidisa and Shimon Weiss
Journal of chemical physics VOLUME 117, Number 24 22 December 2002
For inspiration to DisplacementMap. Fig: 6, Difference-distance matrix for the difference in CA-CA distances.
Structure of a Hinge-bending Bacteriophage T4 Lysozyme Mutant, Ile3 -> Pro
M. M. Dixon, H. Nicholsont, L. Shewchuk W. A. Baase and B. W. Matthews1
J. Mol. Biol. (1992) 227. 917-933


