This is a read-only mirror of pymolwiki.org
Difference between revisions of "Ramp New"
m (2 revisions) |
|||
| (12 intermediate revisions by 3 users not shown) | |||
| Line 1: | Line 1: | ||
[[ramp_new]] creates a color ramp based on a map potential value or based on proximity to a molecular object. | [[ramp_new]] creates a color ramp based on a map potential value or based on proximity to a molecular object. | ||
| − | + | == Usage == | |
| − | + | ramp_new name, map_name [, range [, color [, state [, selection [, | |
| + | beyond [, within [, sigma [, zero ]]]]]]]] | ||
| + | |||
| + | *'''name''' = string: name of the ramp object to create | ||
| + | *'''map_name''' = string: name of the map (for potential) or molecular object (for proximity) | ||
| + | *'''range''' = list: values corresponding to slots in the ramp {default: [-1, 0, 1]} | ||
| + | *'''color''' = list or str: colors corresponding to slots in the ramp or a given palette name: afmhot, grayscale, object, rainbow, traditional, grayable, hot, ocean, and sludge {default: [red, white, blue]} | ||
| + | *'''state''' = integer: state identifier {default: 1} | ||
| + | *'''selection''' = selection: for automatic ranging (maps only) {default: } | ||
| + | * with automatic ranging only: | ||
| + | ** '''beyond''' = number: are we excluding values beyond a certain distance from the selection? {default: 2.0} | ||
| + | ** '''within''' = number: are we only including valuess within a certain distance from the selection? {default: 6.0} | ||
| + | ** '''sigma''' = number: how many standard deviations from the mean do we go? {default: 2.0} | ||
| + | ** '''zero''' = integer: do we force the central value to be zero? {default: 1} | ||
| + | |||
| + | == Color and range interpretation == | ||
| + | |||
| + | === Number of colors and values === | ||
| + | |||
| + | * Obvious case: Same number of values and colors (''len(range) == len(color)'') | ||
| + | * Color palettes: Only first and last value are used as the palette boundaries, with linear interpolation in between | ||
| + | * Less colors than values: The last color will be repeated to fill up the color array | ||
| + | * More colors than values: '''This behavior is deprecated and will change in PyMOL 1.8.'''. If '''N''' is the number of values, then: | ||
| + | ** One extra color: Last color (''color[N]'') will be used for ''values > range[N-1]'' | ||
| + | ** Two extra colors: ''color[N]'' will be used for ''values < range[0]'' and ''color[N+1]'' will be used for ''values > range[N-1]'' | ||
| + | ** More than two extra colors: Like with two extra colors, but ''color[N+2:]'' will be ignored | ||
| + | ** '''Recommended practice: Instead of providing out-of-bounds colors with the last two colors, put them in the beginning and end of the color list and repeat the first and last values in the range list.''' Example with white out-of-bounds coloring: ''range=[0, 0, 10, 10], color=[white, red, blue, white]'' | ||
| + | ** '''Planned change in PyMOL 1.8:''' With two values and more than two colors, colors will be evenly spaced between the two values (like color palettes) | ||
| + | |||
| + | === Supported special colors === | ||
| + | |||
| + | With proximity ramps, in addition to regular named colors (like "blue"), the following special colors are supported: | ||
| + | |||
| + | * atomic: color of closest atom in proximity object | ||
| + | * default: alias for atomic | ||
| + | * object: color of proximity object | ||
| + | * <name of another ramp>: recursive ramp coloring | ||
| + | |||
| + | == Examples == | ||
| + | |||
| + | === Color surface by an APBS calculated electrostatic map === | ||
| + | |||
| + | Example map: http://pymol.org/tmp/1ubq_apbs.dx | ||
| + | |||
| + | <source lang="python"> | ||
| + | load 1ubq_apbs.dx, e_pot_map | ||
| + | fetch 1ubq, async=0 | ||
| + | as surface | ||
| + | |||
| + | ramp_new e_pot_color, e_pot_map, [-5, 0, 5], [red, white, blue] | ||
| + | set surface_color, e_pot_color | ||
| + | set surface_ramp_above_mode | ||
| + | </source> | ||
| + | |||
| + | === Color binding pocket by proximity to ligand === | ||
| + | |||
| + | * Ligand: blue | ||
| + | * Protein within 4 Angstrom of ligand: red | ||
| + | * Protein beyond 8 Angstrom of ligand: yellow | ||
| + | |||
| + | <source lang="python"> | ||
| + | fetch 1rx1, async=0 | ||
| + | extract ligand, organic | ||
| + | color blue, ligand | ||
| + | show surface | ||
| + | |||
| + | ramp_new prox, ligand, [4, 8], [red, yellow] | ||
| + | color prox, 1rx1 | ||
| + | </source> | ||
| + | |||
| + | === Color isosurface by closest atom === | ||
| + | |||
| + | ''See also the [[huge surfaces]] example.'' | ||
| + | |||
| + | Color the isosurface within 2 Angstrom of the protein (without solvent) by atom colors. Everything beyond 2 Angstrom will be gray. | ||
| + | |||
| + | <source lang="python"> | ||
| + | fetch 1rx1, map, async=0, type=2fofc | ||
| + | isosurface surf, map | ||
| + | |||
| + | fetch 1rx1, mol, async=0 | ||
| + | remove solvent | ||
| + | |||
| + | ramp_new prox, mol, [0, 2, 2], [atomic, atomic, gray] | ||
| + | color prox, surf | ||
| + | </source> | ||
| + | |||
| + | Updating the atom colors is possible, for example: | ||
| − | = | + | <source lang="python"> |
| + | spectrum | ||
| + | recolor | ||
| + | </source> | ||
| + | |||
| + | === More user provided examples === | ||
| + | |||
| + | ==== Ramp + Distance Measure ==== | ||
Using a ramp and a distance measure, we can color the surface by some property--here, I'll chose distance from some important atom in the receptor to the ligand atom. | Using a ramp and a distance measure, we can color the surface by some property--here, I'll chose distance from some important atom in the receptor to the ligand atom. | ||
| − | <gallery perrow=3 widths= | + | <gallery perrow=3 widths=250 heights=250> |
Image:Surface_by_prop3.png|Ligand surface colored by distance from some given atom. The remainder of the protein is hidden to more clearly visualize the calculated distances and surface color | Image:Surface_by_prop3.png|Ligand surface colored by distance from some given atom. The remainder of the protein is hidden to more clearly visualize the calculated distances and surface color | ||
| − | |||
Image:Surface_by_prop.png | Image:Surface_by_prop.png | ||
</gallery> | </gallery> | ||
| Line 22: | Line 115: | ||
| + | Another possible application of the ramp_new command can be the representation of the ELF function [http://en.wikipedia.org/wiki/Electron_localization_function]. This function can be calculated with the TopMod software [http://www.lct.jussieu.fr/suite64.html]. | ||
| − | + | * Load the cube file containing the ELF function, e.g. H2O_elf.cube. | |
| − | <source lang="python"> | + | * Create an isosurface with a contour level of 0.8. |
| − | + | <source lang="python">isosurface elf, H2O_elf, 0.8</source> | |
| − | ramp_new | + | * Load the cube containing the basin information, e.g. H20_esyn.cube. Basically in this cube for each point in the first cube you have either one of the numbers from 1 to 5. More details on what these numbers mean can be found in the TopMod manual. |
| − | + | * Create a new ramp. | |
| + | <source lang="python">ramp_new ramp, H2O_esyn, [1, 2, 3, 5], [tv_orange, lightblue, palegreen, deeppurple]</source> | ||
| + | * Assign the color ramp to the ELF isosurface. | ||
| + | <source lang="python">set surface_color, ramp, elf</source> | ||
| + | * Rebuild if necessary. | ||
| + | <source lang="python">rebuild</source> | ||
| + | |||
| + | <gallery perrow=2 widths=250 heights=250> | ||
| + | Image:H2O.png|Localization domains of H2O. The bounding isosurface is ELF=0.8 | ||
| + | Image:BeCl2.png|Localization domains of BeCl2. The bounding isosurface is ELF=0.8 | ||
| + | </gallery> | ||
| + | |||
| + | ==== Surface Colored by Distance from a Point ==== | ||
| + | See [[Spectrum]] for another method that allows for more flexible coloring schemes, but needs more work to get there. | ||
| + | |||
| + | <gallery widths=400 heights=250> | ||
| + | Image:Measure.png | ||
| + | </gallery> | ||
| + | This example shows how to color a protein surface by its distance from a given point: | ||
| − | |||
| − | |||
| − | |||
| − | |||
| − | |||
| − | |||
| − | |||
| − | |||
| − | |||
| − | |||
| − | |||
| − | |||
| − | |||
| − | |||
| − | |||
| − | |||
| − | |||
| − | |||
| − | |||
<source lang="python"> | <source lang="python"> | ||
| − | ramp_new | + | # fetch a friendly protein |
| + | |||
| + | fetch 1hug, async=0 | ||
| + | |||
| + | # show it as a surface | ||
| + | |||
| + | as surface | ||
| + | |||
| + | # create a pseudoatom at the origin; we will | ||
| + | # measure the distance from this point | ||
| + | |||
| + | pseudoatom pOrig, pos=(0,0,0), label=origin | ||
| + | |||
| + | # create a new color ramp, measuring the distance | ||
| + | # from pOrig to 1hug, colored as rainbow | ||
| + | |||
| + | ramp_new proximityRamp, pOrig, selection=1hug, range=[5,65], color=rainbow | ||
| + | |||
| + | # set the surface color to the ramp coloring | ||
| + | |||
| + | set surface_color, proximityRamp, 1hug | ||
| + | |||
| + | # some older PyMOLs need this recoloring/rebuilding | ||
| + | |||
| + | recolor; rebuild | ||
</source> | </source> | ||
| − | == | + | ====Coloring a Viral Capsid by Distance from Core==== |
| + | <gallery heights=350 widths=350> | ||
| + | Image:Capsid_by_dist.png | ||
| + | </gallery> | ||
<source lang="python"> | <source lang="python"> | ||
| − | + | # create a pseudoatom at the origin-- we will | |
| − | + | # measure the distance from this point | |
| + | |||
| + | pseudoatom pOrig, pos=(0,0,0), label=origin | ||
| + | |||
| + | # fetch and build the capsid | ||
| + | |||
| + | fetch 2xpj, async=0, type=pdb1 | ||
| + | split_states 2xpj | ||
| + | delete 2xpj | ||
| + | |||
| + | # show all 60 subunits it as a surface | ||
| + | # this will take a few minutes to calculate | ||
| + | |||
| + | as surface | ||
| + | |||
| + | # create a new color ramp, measuring the distance | ||
| + | # from pOrig to 1hug, colored as rainbow | ||
| − | + | ramp_new proximityRamp, pOrig, selection=(2xpj*), range=[110,160], color=rainbow | |
| − | |||
| − | + | # set the surface color to the ramp coloring | |
| − | |||
| − | + | set surface_color, proximityRamp, (2xpj*) | |
| − | + | # some older PyMOLs need this recoloring/rebuilding | |
| − | + | recolor | |
| − | |||
</source> | </source> | ||
| − | = See Also = | + | == See Also == |
| + | |||
[[load]], [[color]], [[create]], [[slice]], [[gradient]], [[Expand_To_Surface]] | [[load]], [[color]], [[create]], [[slice]], [[gradient]], [[Expand_To_Surface]] | ||
[[Category:Commands|Ramp new]] | [[Category:Commands|Ramp new]] | ||
| + | [[Category:Coloring]] | ||
Latest revision as of 17:32, 14 August 2015
ramp_new creates a color ramp based on a map potential value or based on proximity to a molecular object.
Usage
ramp_new name, map_name [, range [, color [, state [, selection [,
       beyond [, within [, sigma [, zero ]]]]]]]]
- name = string: name of the ramp object to create
- map_name = string: name of the map (for potential) or molecular object (for proximity)
- range = list: values corresponding to slots in the ramp {default: [-1, 0, 1]}
- color = list or str: colors corresponding to slots in the ramp or a given palette name: afmhot, grayscale, object, rainbow, traditional, grayable, hot, ocean, and sludge {default: [red, white, blue]}
- state = integer: state identifier {default: 1}
- selection = selection: for automatic ranging (maps only) {default: }
- with automatic ranging only:
- beyond = number: are we excluding values beyond a certain distance from the selection? {default: 2.0}
- within = number: are we only including valuess within a certain distance from the selection? {default: 6.0}
- sigma = number: how many standard deviations from the mean do we go? {default: 2.0}
- zero = integer: do we force the central value to be zero? {default: 1}
Color and range interpretation
Number of colors and values
- Obvious case: Same number of values and colors (len(range) == len(color))
- Color palettes: Only first and last value are used as the palette boundaries, with linear interpolation in between
- Less colors than values: The last color will be repeated to fill up the color array
- More colors than values: This behavior is deprecated and will change in PyMOL 1.8.. If N is the number of values, then:
- One extra color: Last color (color[N]) will be used for values > range[N-1]
- Two extra colors: color[N] will be used for values < range[0] and color[N+1] will be used for values > range[N-1]
- More than two extra colors: Like with two extra colors, but color[N+2:] will be ignored
- Recommended practice: Instead of providing out-of-bounds colors with the last two colors, put them in the beginning and end of the color list and repeat the first and last values in the range list. Example with white out-of-bounds coloring: range=[0, 0, 10, 10], color=[white, red, blue, white]
- Planned change in PyMOL 1.8: With two values and more than two colors, colors will be evenly spaced between the two values (like color palettes)
Supported special colors
With proximity ramps, in addition to regular named colors (like "blue"), the following special colors are supported:
- atomic: color of closest atom in proximity object
- default: alias for atomic
- object: color of proximity object
- <name of another ramp>: recursive ramp coloring
Examples
Color surface by an APBS calculated electrostatic map
Example map: http://pymol.org/tmp/1ubq_apbs.dx
load 1ubq_apbs.dx, e_pot_map
fetch 1ubq, async=0
as surface

ramp_new e_pot_color, e_pot_map, [-5, 0, 5], [red, white, blue]
set surface_color, e_pot_color
set surface_ramp_above_mode
Color binding pocket by proximity to ligand
- Ligand: blue
- Protein within 4 Angstrom of ligand: red
- Protein beyond 8 Angstrom of ligand: yellow
fetch 1rx1, async=0
extract ligand, organic
color blue, ligand
show surface

ramp_new prox, ligand, [4, 8], [red, yellow]
color prox, 1rx1
Color isosurface by closest atom
See also the huge surfaces example.
Color the isosurface within 2 Angstrom of the protein (without solvent) by atom colors. Everything beyond 2 Angstrom will be gray.
fetch 1rx1, map, async=0, type=2fofc
isosurface surf, map

fetch 1rx1, mol, async=0
remove solvent

ramp_new prox, mol, [0, 2, 2], [atomic, atomic, gray]
color prox, surf
Updating the atom colors is possible, for example:
spectrum
recolor
More user provided examples
Ramp + Distance Measure
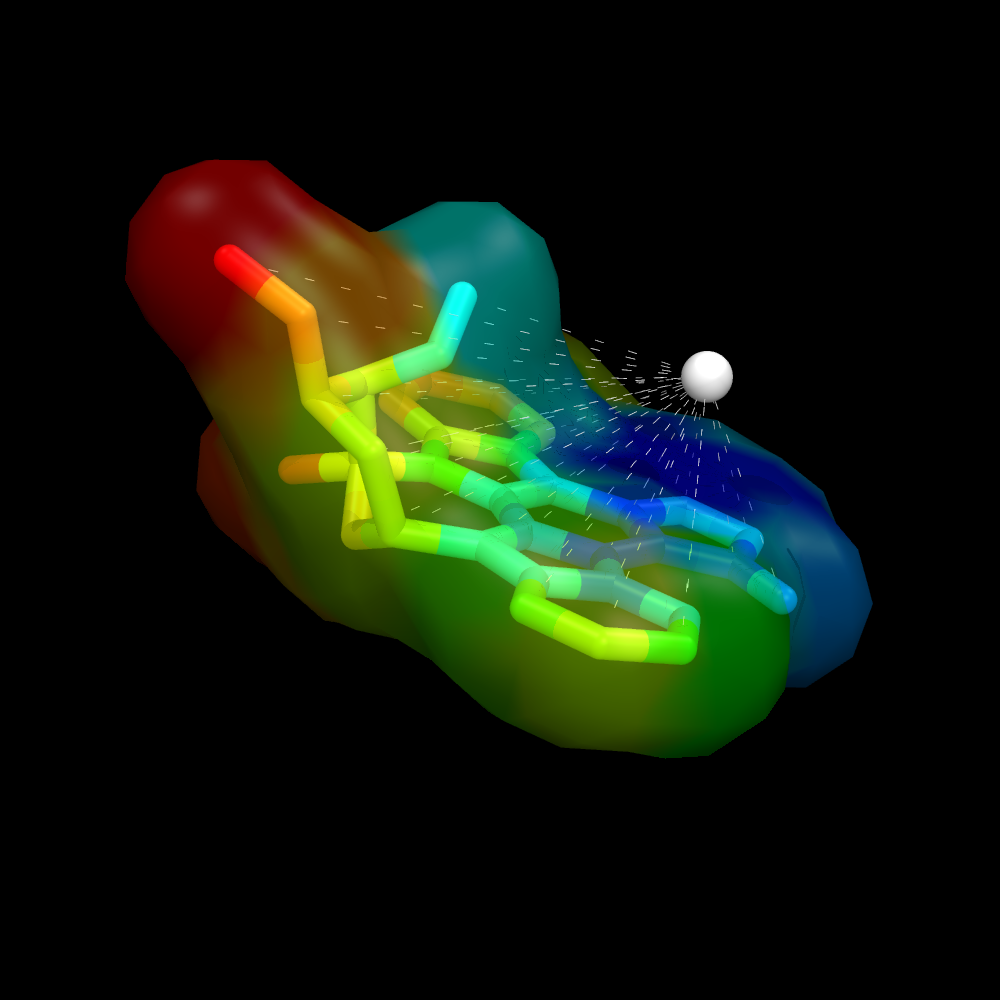
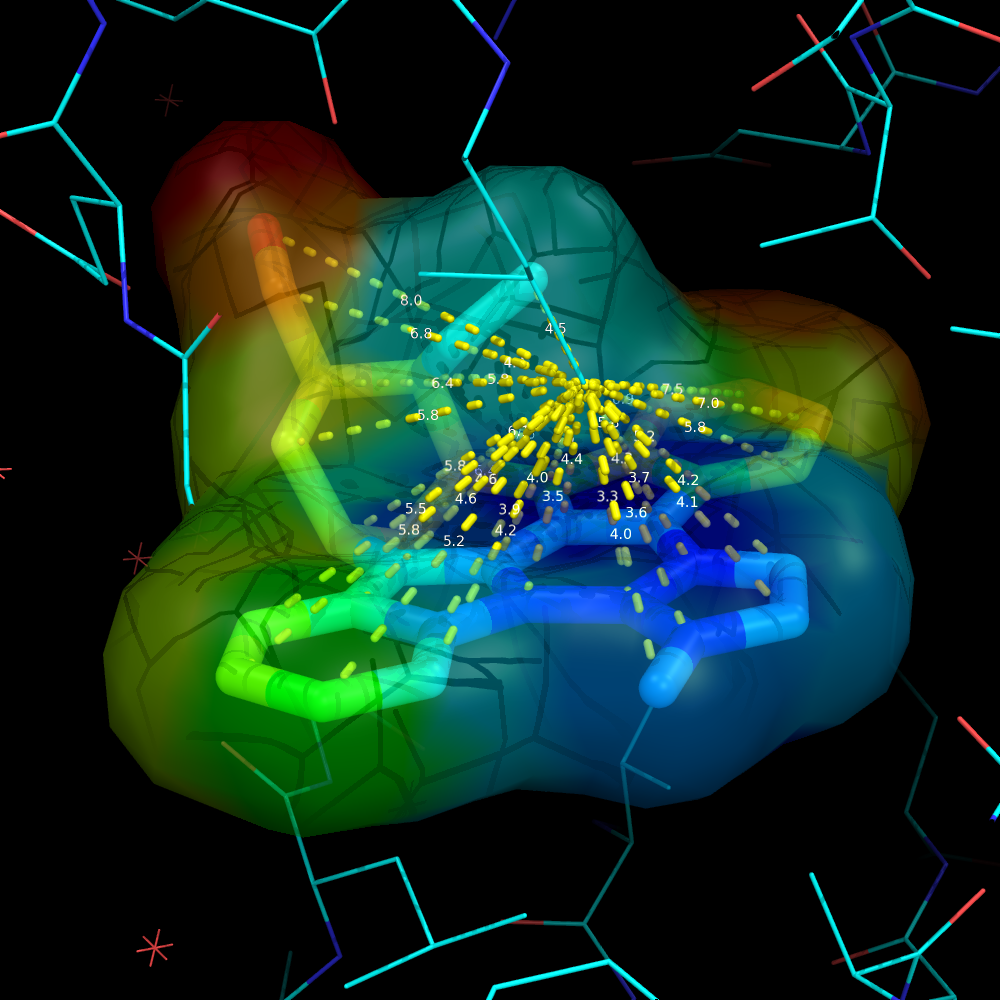
Using a ramp and a distance measure, we can color the surface by some property--here, I'll chose distance from some important atom in the receptor to the ligand atom.
To reproduce the results shown here you must do the following:
- obtain a protein
- calculate some property for some set of atoms (like distance from some central location) and stuff the values into the b-factor
- create a new object from the atoms for which you just measured a property
- create a new ramp from the object with ramp_new
- set the surface color of the new object
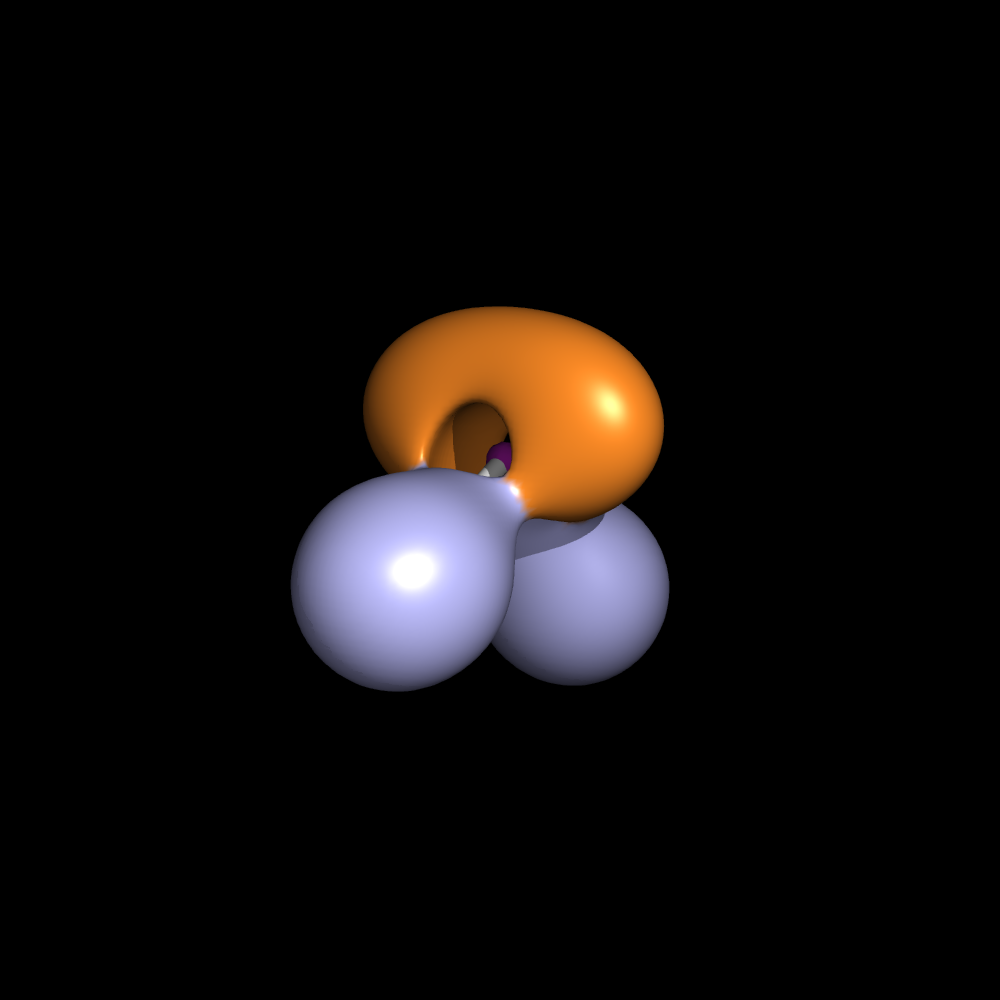
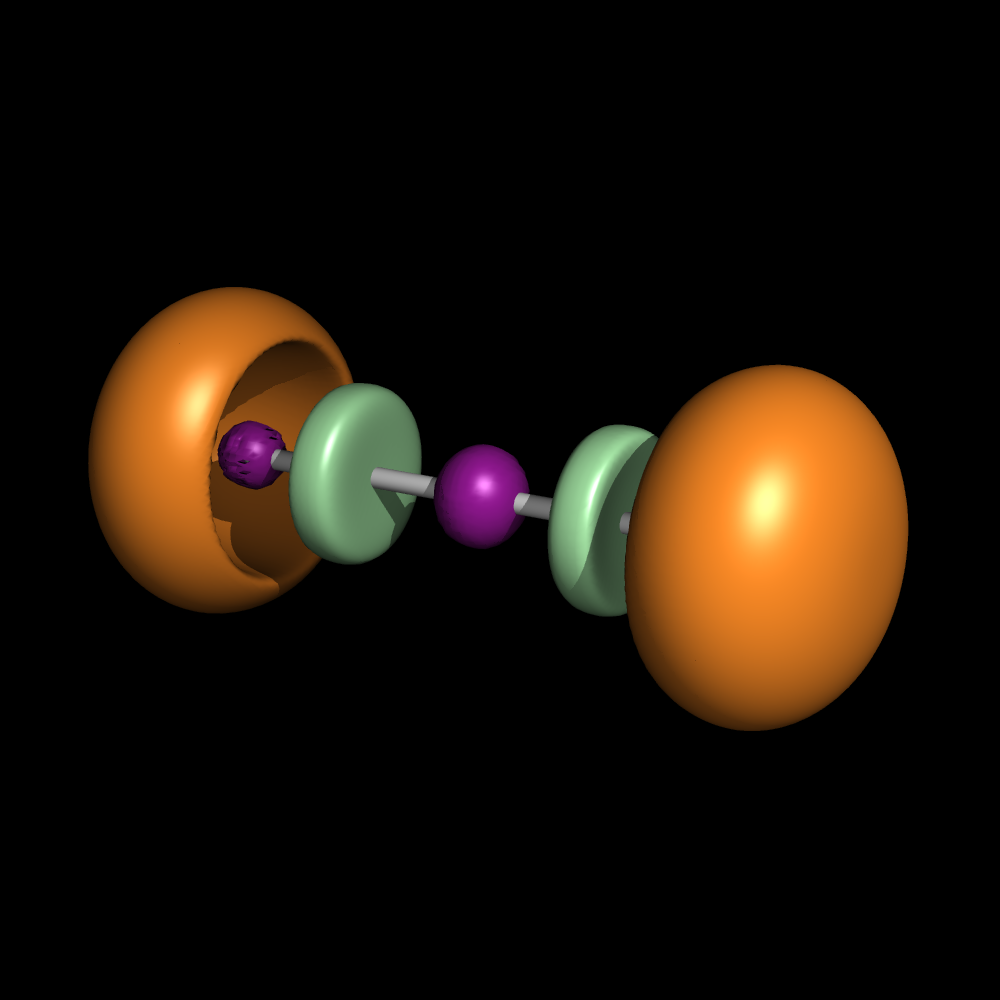
Another possible application of the ramp_new command can be the representation of the ELF function [1]. This function can be calculated with the TopMod software [2].
- Load the cube file containing the ELF function, e.g. H2O_elf.cube.
- Create an isosurface with a contour level of 0.8.
isosurface elf, H2O_elf, 0.8
- Load the cube containing the basin information, e.g. H20_esyn.cube. Basically in this cube for each point in the first cube you have either one of the numbers from 1 to 5. More details on what these numbers mean can be found in the TopMod manual.
- Create a new ramp.
ramp_new ramp, H2O_esyn, [1, 2, 3, 5], [tv_orange, lightblue, palegreen, deeppurple]
- Assign the color ramp to the ELF isosurface.
set surface_color, ramp, elf
- Rebuild if necessary.
rebuild
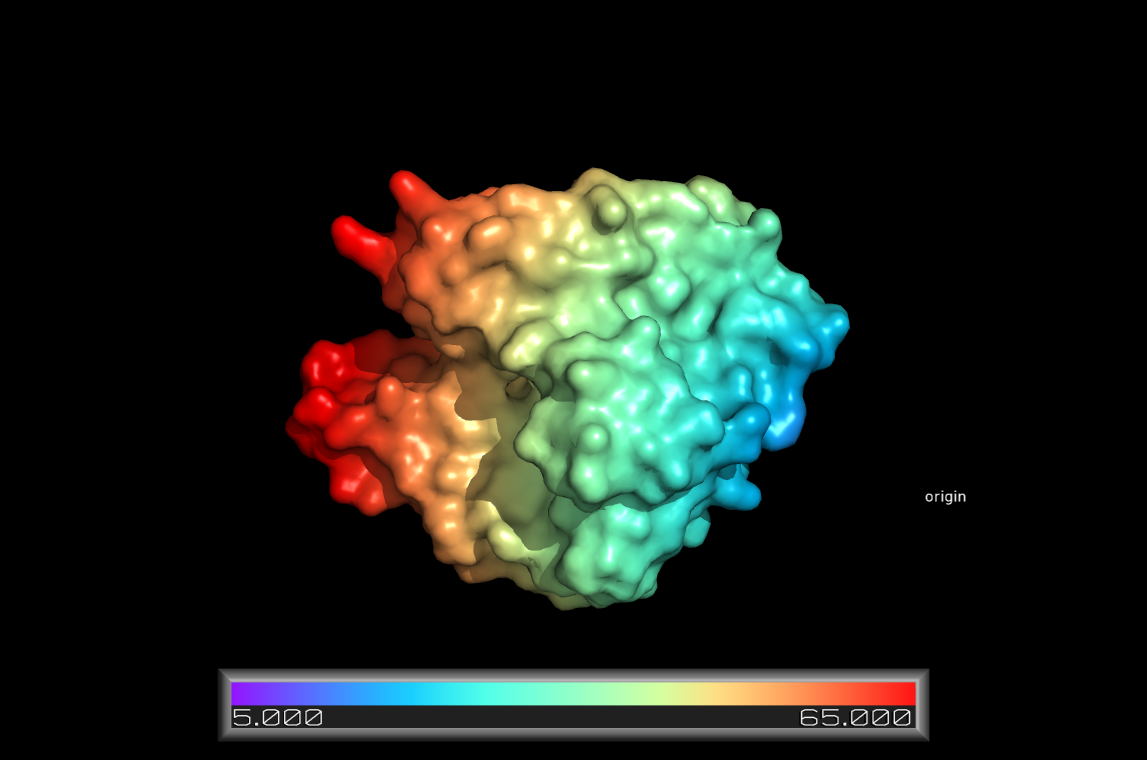
Surface Colored by Distance from a Point
See Spectrum for another method that allows for more flexible coloring schemes, but needs more work to get there.
This example shows how to color a protein surface by its distance from a given point:
# fetch a friendly protein

fetch 1hug, async=0

# show it as a surface

as surface

# create a pseudoatom at the origin; we will
# measure the distance from this point

pseudoatom pOrig, pos=(0,0,0), label=origin

# create a new color ramp, measuring the distance
# from pOrig to 1hug, colored as rainbow

ramp_new proximityRamp, pOrig, selection=1hug, range=[5,65], color=rainbow

# set the surface color to the ramp coloring

set surface_color, proximityRamp, 1hug

# some older PyMOLs need this recoloring/rebuilding

recolor; rebuild
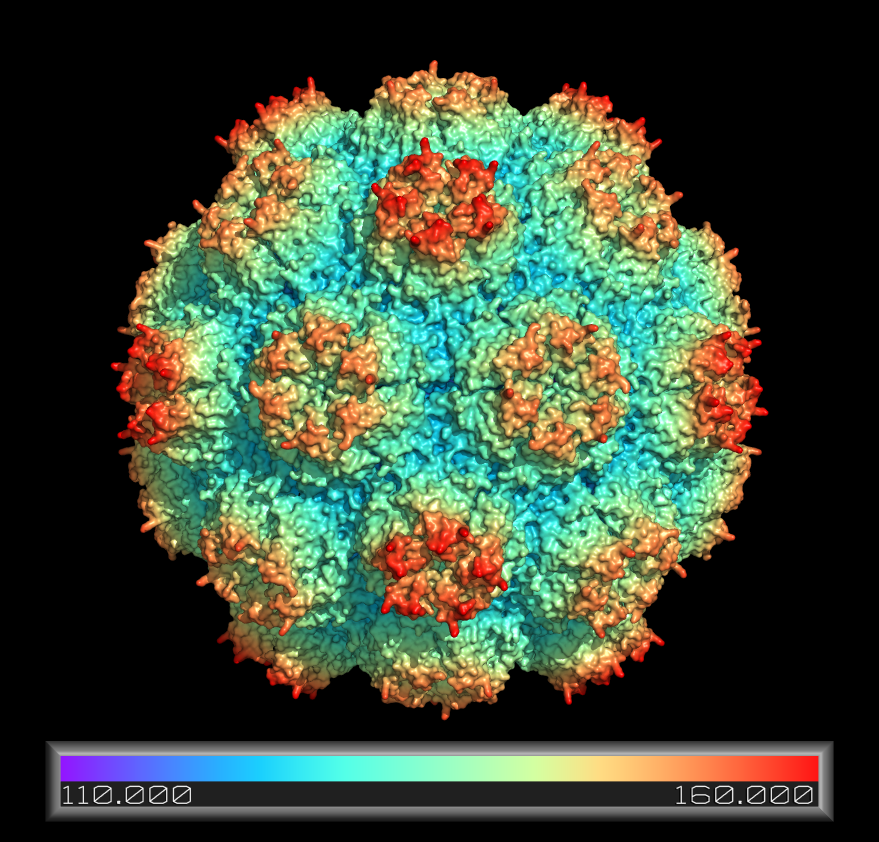
Coloring a Viral Capsid by Distance from Core
# create a pseudoatom at the origin-- we will
# measure the distance from this point

pseudoatom pOrig, pos=(0,0,0), label=origin

# fetch and build the capsid

fetch 2xpj, async=0, type=pdb1
split_states 2xpj
delete 2xpj

# show all 60 subunits it as a surface
# this will take a few minutes to calculate

as surface

# create a new color ramp, measuring the distance
# from pOrig to 1hug, colored as rainbow

ramp_new proximityRamp, pOrig, selection=(2xpj*), range=[110,160], color=rainbow

# set the surface color to the ramp coloring

set surface_color, proximityRamp, (2xpj*)

# some older PyMOLs need this recoloring/rebuilding

recolor
