This is a read-only mirror of pymolwiki.org
Difference between revisions of "Display CCP4 Maps"
| Line 5: | Line 5: | ||
simple map or a ''n''Fo-''m''Fc map as you wish. Select the option to cover 'all | simple map or a ''n''Fo-''m''Fc map as you wish. Select the option to cover 'all | ||
atoms in PDB file'. For pymol to read the map later, you will need to | atoms in PDB file'. For pymol to read the map later, you will need to | ||
| − | add the file extension .ccp4 to the generated map. You may find this map | + | add the file extension .map.ccp4 to the generated map. You may find this map |
too coarse to make for a pretty diagram. You can generate a nicer | too coarse to make for a pretty diagram. You can generate a nicer | ||
(albeit much larger) map by re-running '''fft''' with a tighter grid spacing. | (albeit much larger) map by re-running '''fft''' with a tighter grid spacing. | ||
| Line 15: | Line 15: | ||
as sticks. | as sticks. | ||
| − | 3. Open your map in pymol, ''e.g.'' mymap.ccp4 (you need the ccp4 | + | 3. Open your map in pymol, ''e.g.'' mymap.map.ccp4 (you need the ccp4 |
| − | extension). An object named ''mymap'' will be created by pymol. | + | extension). An object named ''mymap.map'' will be created by pymol. |
4. To display the map around your selection (''e.g.'', named ''site'') issue a | 4. To display the map around your selection (''e.g.'', named ''site'') issue a | ||
command similar to this: | command similar to this: | ||
<pre> | <pre> | ||
| − | isomesh map, mymap, 2.0, site, carve=1.6 | + | isomesh map, mymap.map, 2.0, site, carve=1.6 |
</pre> | </pre> | ||
| − | This command will create a mesh map object named ''map'' from the object ''mymap,'' | + | This command will create a mesh map object named ''map'' from the object ''mymap.map,'' |
contoured at 2.0 sigma, around the selection ''site'', within 1.6A of selected atoms. You can | contoured at 2.0 sigma, around the selection ''site'', within 1.6A of selected atoms. You can | ||
change the contour level and carve parameter to suit. | change the contour level and carve parameter to suit. | ||
Revision as of 19:34, 16 April 2008
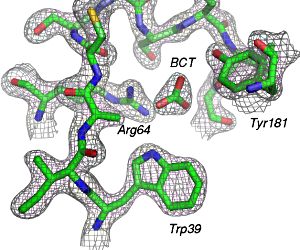
The following steps can be used to read CCP4-format electron density maps into pymol for the generation of publication-quality images.
1. Use fft to create a map in CCP4. (This task can be run from the Run FFT-Create Map option under Map & Mask Utilities) You can create a simple map or a nFo-mFc map as you wish. Select the option to cover 'all atoms in PDB file'. For pymol to read the map later, you will need to add the file extension .map.ccp4 to the generated map. You may find this map too coarse to make for a pretty diagram. You can generate a nicer (albeit much larger) map by re-running fft with a tighter grid spacing. I usually take the default values generated by FFT and double them. You can change grid spacing under Infrequently Used Options.
2. Open pymol and read in your PDB file. Create a selection about whatever you want to see the map around. Typically one would display the selection as sticks.
3. Open your map in pymol, e.g. mymap.map.ccp4 (you need the ccp4 extension). An object named mymap.map will be created by pymol.
4. To display the map around your selection (e.g., named site) issue a command similar to this:
isomesh map, mymap.map, 2.0, site, carve=1.6
This command will create a mesh map object named map from the object mymap.map, contoured at 2.0 sigma, around the selection site, within 1.6A of selected atoms. You can change the contour level and carve parameter to suit.
5. For a publication quality figure the following are suggestions:
color grey30, map # sets map to 30% gray
bg_color white #sets background to white
set ray_trace_fog, 0 #turns off raytrace fog--optional
set depth_cue, 0 # turns off depth cueing--optional
set ray_shadows, off #turns off ray-tracing shadows
ray 1024 1024 # this would create a 1024x1024 pixel ray-traced image
png image.png #output final image
Labels can be added in GIMP or Photoshop. With these directions you should be able to create an image similar to the following one:
